
ADU Cost Calculator: A 20-Line Budget With Sources
By The Dwelling Index Editorial Team · Updated September 2026
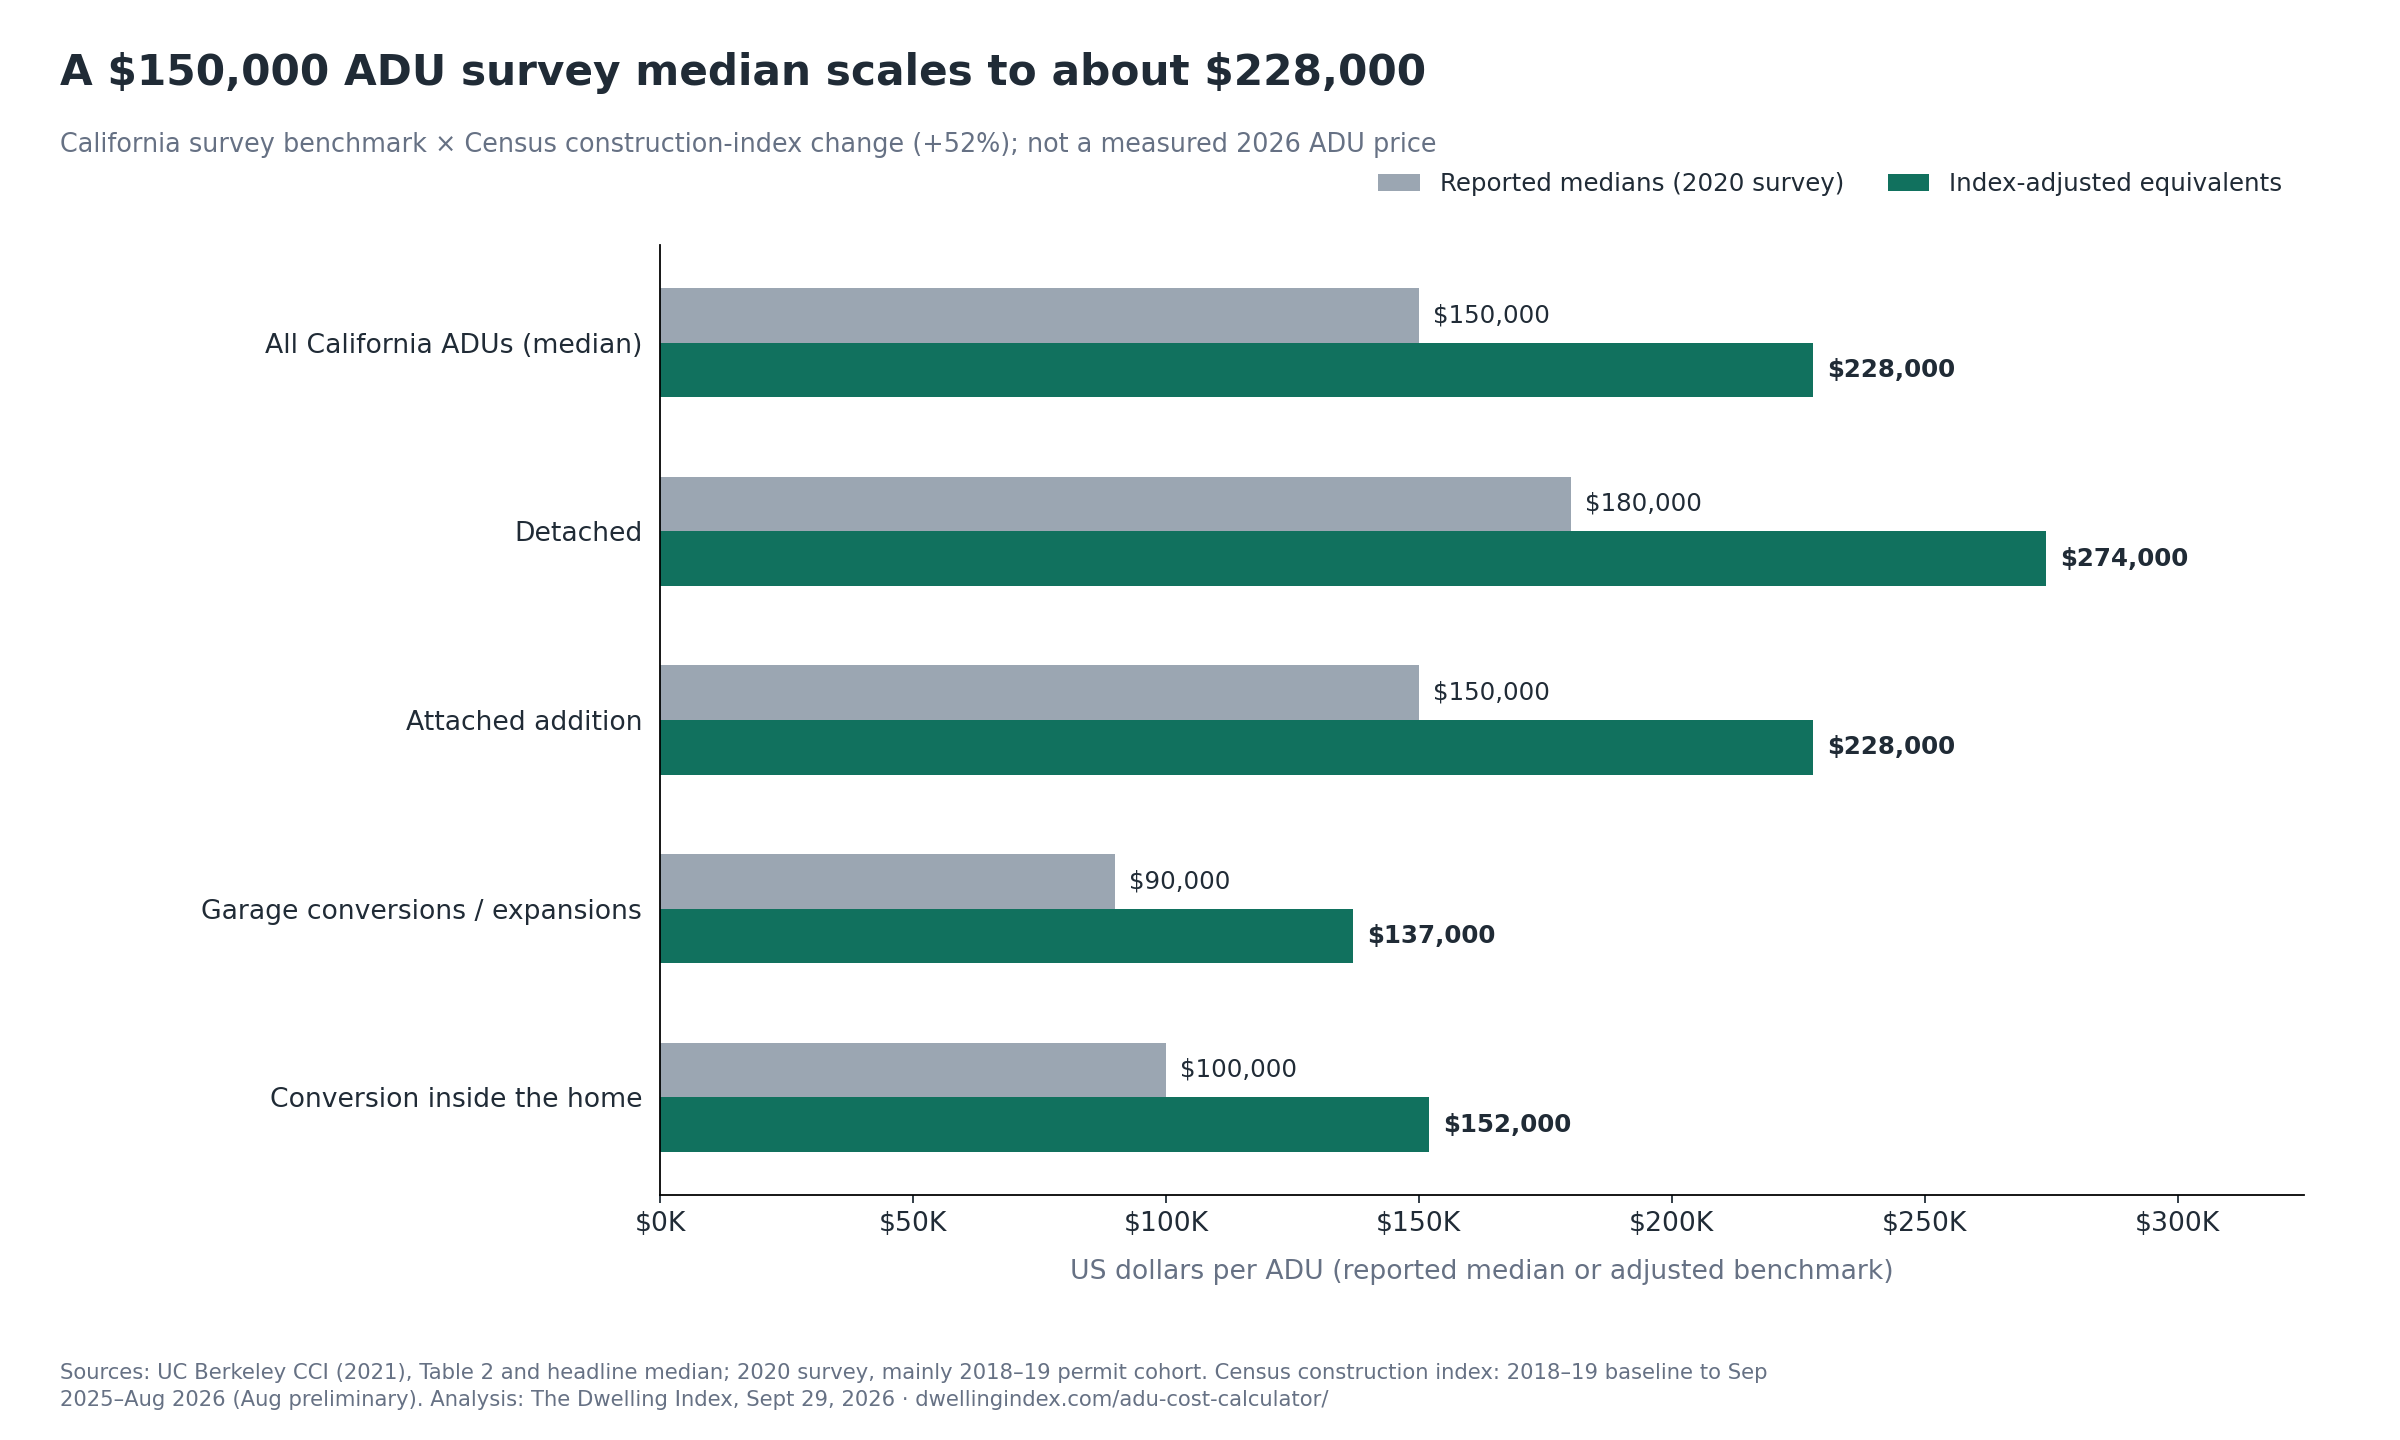
Use this ADU cost calculator to check a 20-line budget. California's published $150,000 ADU median becomes about $228,000 when scaled by a Census index from a 2018–19 baseline to September 2025–August 2026, according to The Dwelling Index's analysis. That is an index-adjusted benchmark, not a newly measured ADU price. Sources and math.
How does this ADU cost calculator work?
Pick your ADU type, size and state. You'll get an illustrative starting number, two cost scenarios, and the source behind each input. An ADU, or accessory dwelling unit, is a second, smaller home on the same lot — a backyard cottage, a garage apartment, or a unit carved out of the main house.
The calculator has two tabs.
Quick estimate gives you a model to explore, not a quote. In California, it starts from survey medians scaled by a construction-price index. Elsewhere, it combines regional contractor-built house prices with California ADU-to-house ratios. The low and high scenarios are two-thirds and four-thirds of the model result. Those are examples, not limits on what a build can cost.
Check a quote is for when you have real prices. Enter each line from your quotes. Mark every line as priced, included in another line, not needed, or not priced yet. The tool never treats a blank as $0. If something isn't priced, it says so in plain words instead of showing you a total that looks finished.
The source tables and data downloads below are free. No email, no account.
Interactive tool · Runs in this browser
ADU cost calculator
Choose a dated model to explore, or enter quote lines to keep missing and included costs visible.
Choose a state or the national option to see an estimate; the calculator does not silently assume a national location.
The calculator does not submit your inputs to a calculator service. Your quotes and notes stay in this page and are included only if you choose to download or print them.
Key ADU cost statistics
- California's published $150,000 ADU survey median becomes about $228,000 when scaled from a 2018–19 index baseline to September 2025–August 2026 (+52%); this is The Dwelling Index's index-adjusted benchmark, not a measured 2026 median. (Survey; index; math.)
- UC Berkeley's 2020 survey of California's mainly 2018–19 permit cohort reported a $180,000 detached-ADU median and $300 per sq ft; The Dwelling Index's index adjustment gives about $274,000 and $456 per sq ft, not a new observation. (Table 2; index.)
- UC Berkeley's 2020 California survey reported a $90,000 median for garage conversions and expansions, half its detached median; the index-adjusted equivalent is about $137,000. (UC Berkeley Table 2; adjustment.)
- In UC Berkeley's 2020 California survey, 71% of 623 cost respondents fell in the published bands through $200,000; The Dwelling Index's index adjustment moves that cutoff to about $304,000. (Appendix B; math.)
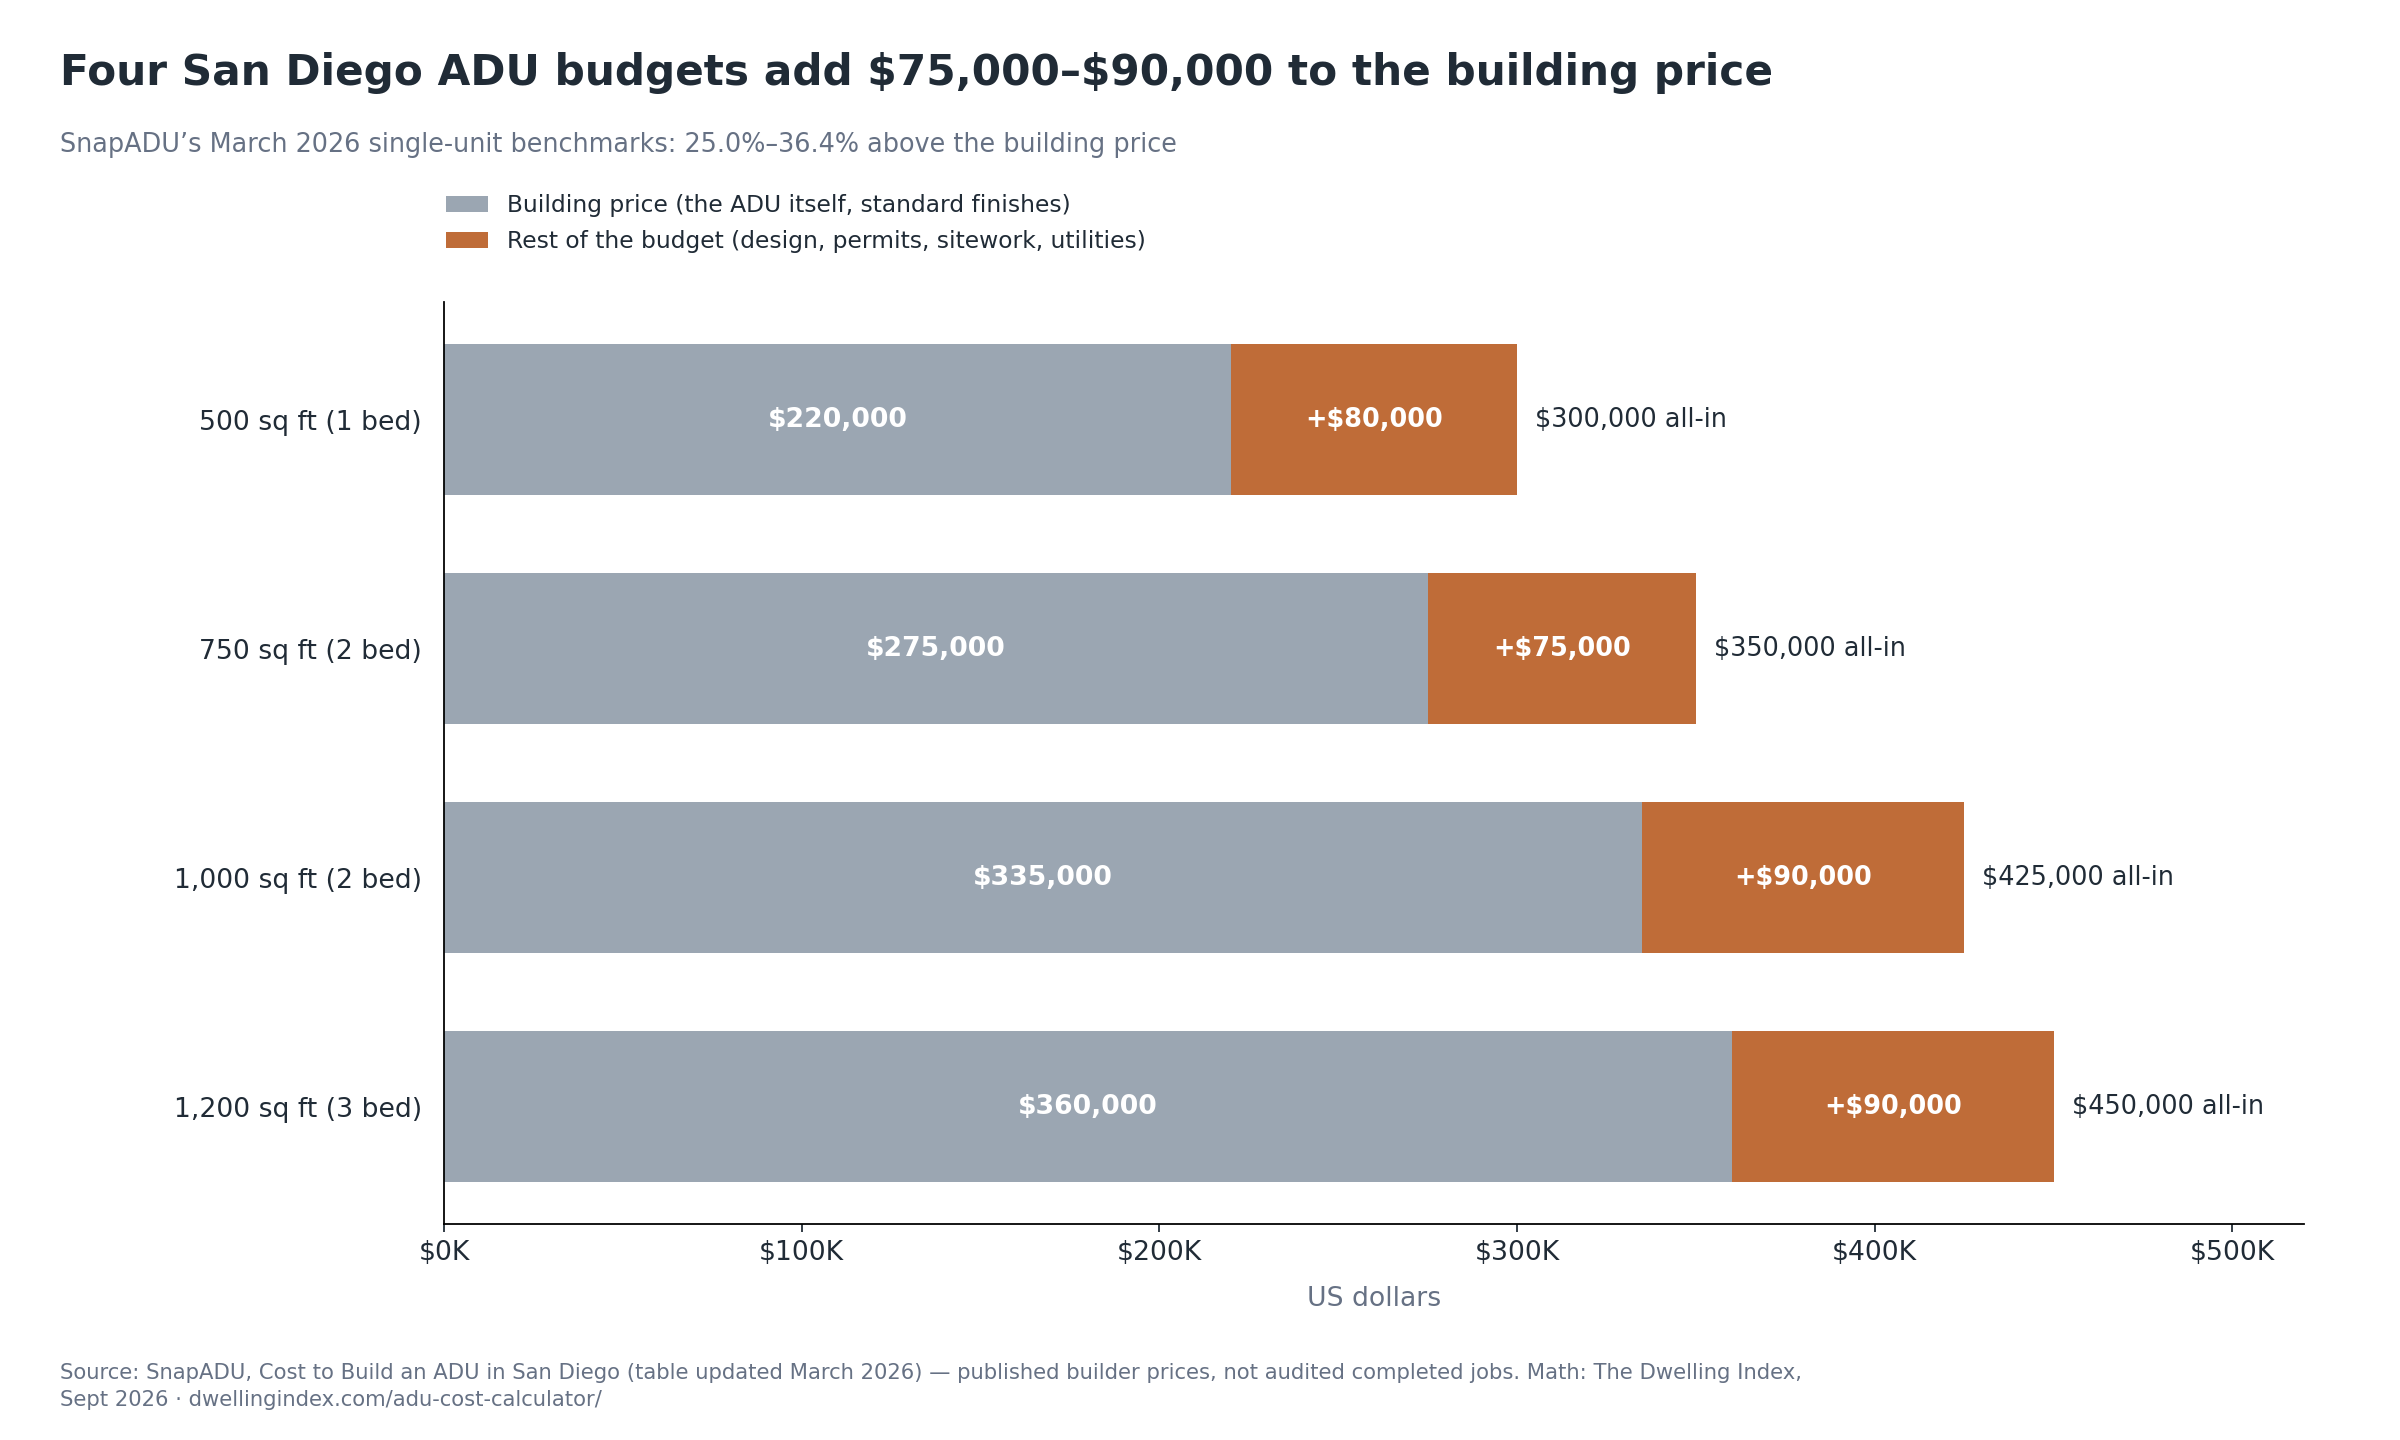
- In all four single-ADU rows of SnapADU's March 2026 San Diego table, the all-in budget is $75,000–$90,000 above the building price, or 25.0%–36.4% more; differences calculated by The Dwelling Index. (Source table; our table.)
- The Census construction-price index averaged 201.3 in September 2025–August 2026, 52.1% above its 132.4 average for 2018–2019; August is preliminary. (Census source; calculations.)
- The U.S. median contract price for a new contractor-built single-family house started in 2025 was $171.57 per sq ft, up 47.7% from $116.16 in 2019, excluding improved lot value. (Census source.)
- The California survey's $300 detached-ADU median per sq ft is 2.13 times $140.605, the average of the West's 2018 and 2019 annual median house contract prices; these have different cost scopes and do not isolate a size premium. (UC Berkeley; Census; comparison.)
- Building an ADU's author put a 2019 Portland 800 sq ft example at $210,667, 24.8% above his $168,750 estimate for 400 sq ft; these are author-estimated size examples, not matched project averages. (Primary source; math.)
- UC Berkeley's 2020 survey reported a $329.17-per-sq-ft median in the Bay Area, versus $197.22 in Los Angeles County, for its mainly 2018–19 permit cohort; project types differed by region. (Table 2.)
- As checked September 29, 2026, California bars local impact fees on ADUs with 750 sq ft of interior livable space or less; other fee categories have separate rules. (Government Code §66311.5(c).)
- California's 2026 maximum Level 1 residential school-fee rate is $5.38 per assessable sq ft, or $4,304 for a chargeable 800-sq-ft example; it is not a cap on every fee level, and district assessment must be confirmed. (State Allocation Board; Education Code.)
- In UC Berkeley's 2020 California ADU survey, 52% of 694 financing respondents used cash (363 responses, rounded); owners could report more than one source. (Figure 7; counts.)
On this page: Reported and index-adjusted ADU costs · Where $150,000 comes from · Cost by type · Cost by size · What a building price leaves out · Cost per square foot vs. a house · Cost in your region · California fees · How people pay · How we built this · How to cite · Download the data · FAQ
What does an ADU cost today?
About $228,000 is the index-adjusted equivalent of UC Berkeley's $150,000 California ADU survey median—not a measured price today. The survey was fielded in 2020 for a mainly 2018–19 permit or occupancy cohort. We apply the Census construction index from a 2018–19 baseline to September 2025–August 2026. The detached-ADU benchmark becomes about $274,000.
A median is the middle of an ordered set: at least half the values are at or below it and at least half are at or above it. It is not the cheapest or fanciest project. Here it describes the survey sample, not every California ADU.
| ADU group | Reported survey median | Reported per sq ft | Index-adjusted equivalent | Adjusted per sq ft |
|---|---|---|---|---|
| All California ADUs | $150,000 | $250 | $228,000 | $380 |
| Detached | $180,000 | $300 | $274,000 | $456 |
| Attached addition to the main home | $150,000 | $250 | $228,000 | $380 |
| Garage (conversions and garage expansions) | $90,000 | $189 | $137,000 | $288 |
| Conversion inside the main home | $100,000 | $173 | $152,000 | $263 |
| San Francisco Bay Area (all types) | $177,500 | $329 | $270,000 | $501 |
| Central Coast (all types) | $140,000 | $223 | $213,000 | $339 |
| Orange and San Diego counties (all types) | $130,000 | $200 | $198,000 | $304 |
| Los Angeles County (all types) | $100,000 | $197 | $152,000 | $300 |
| Source: UC Berkeley Center for Community Innovation, Implementing the Backyard Revolution (April 2021), Table 2; U.S. Census Bureau price index, Sep 2025–Aug 2026 average. Index adjustments: The Dwelling Index, September 29, 2026. Survey fielded in 2020; mainly 2018–19 permit/occupancy cohort, not verified spending dates. Totals round to $1,000 and per-foot figures to $1. This scales historical medians; it does not remeasure the market. | ||||
Say you're pricing a 600-square-foot backyard cottage in California. The model returns about $274,000. The $180,000 source median covers all detached survey responses, not just 600-square-foot units. We chose 600 square feet as the model's comparison size; dividing two medians does not establish the typical size.
Want the national picture by type and region? Our full guide to ADU costs walks through it.
Why is the $150,000 ADU figure out of date?
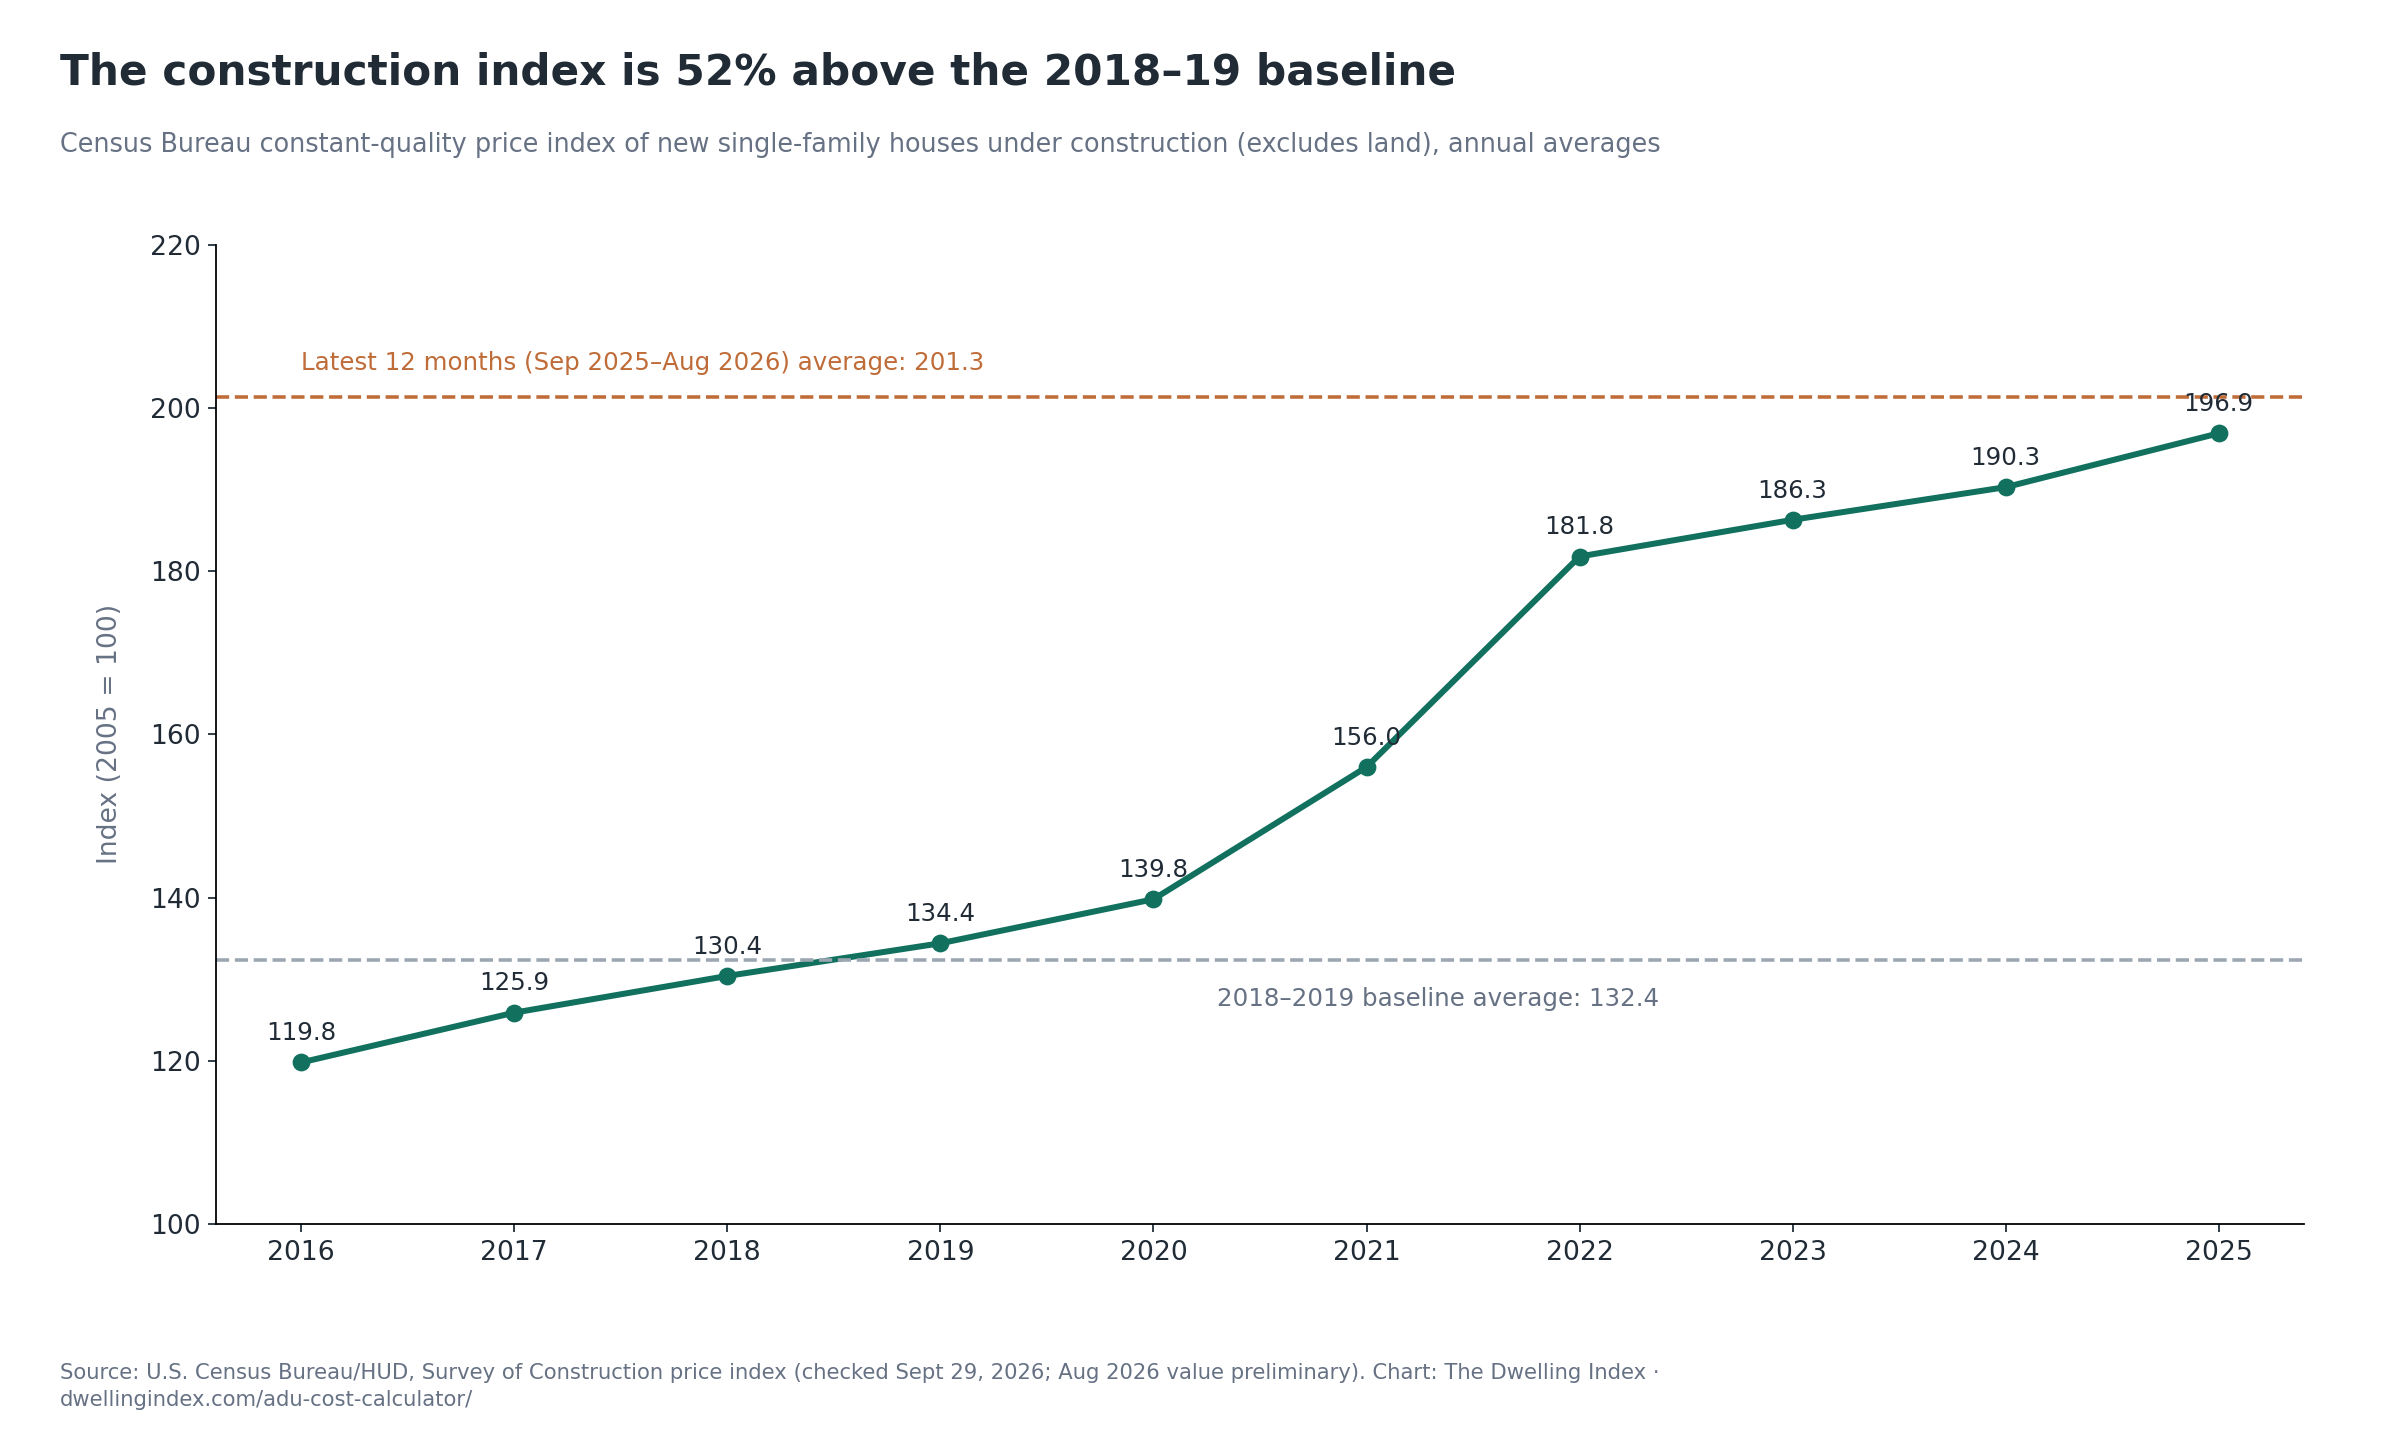
The $150,000 median comes from a 2020 survey aimed mainly at California ADUs that applied for a permit or received a certificate of occupancy in 2018 or 2019. Using those years as our price baseline, the Census construction index is 52% higher in the latest 12-month window. Its biggest annual jumps in the displayed period were 2021 (+11.6%) and 2022 (+16.5%). The report's April 2021 publication date is not the year every owner paid their costs.
Here's where it comes from. In late summer and fall 2020, UC Berkeley's Center for Community Innovation mailed survey invitations to 15,745 California households. The final response rate was 4.8%. The survey counted owner-reported spending on design, labor, materials and permits. Its sample overrepresented Bay Area owners and was more affluent than California homeowners overall; it was not a representative statewide price sample.
A price index tracks what the same kind of thing costs from one year to the next. This one — the Census Bureau's constant-quality index for new single-family houses under construction — leaves out land and other nonconstruction costs. Applying it to an ADU owner's full reported budget assumes that the whole budget changed at the same rate. It is not an ADU-specific index. (Census methods.)
| Period | Index |
|---|---|
| 2016 | 119.8 |
| 2017 | 125.9 |
| 2018 | 130.4 |
| 2019 | 134.4 |
| 2020 | 139.8 |
| 2021 | 156.0 |
| 2022 | 181.8 |
| 2023 | 186.3 |
| 2024 | 190.3 |
| 2025 | 196.9 |
| 2018–2019 average (chosen price baseline) | 132.4 |
| Sep 2025–Aug 2026 average (adjustment window) | 201.3 |
| Source: U.S. Census Bureau/HUD, Survey of Construction, price indexes of new single-family houses under construction, checked Sept. 29, 2026. June–July 2026 values are revised; August 2026 is preliminary. | |
The math is one division: (2,416.1 ÷ 12) ÷ 132.4 = 1.52070745… . Multiply $150,000 by that factor and the result is $228,106, or about $228,000. That is the price-index adjustment—not proof of what the same project would cost to build now.
A second Census number points the same way. The median contract price for a new contractor-built house rose from $116.16 per square foot in 2019 to $171.57 in 2025, up 47.7%. The index rose 46.5% over those same years. Two different Census measures showing increases—not an independent test of the ADU model. The contract-price median also changes with the mix of homes built.
Where the $181,000 figure comes from
Another number you may run into is $181,000. It traces to Building an ADU, which reports a $180,833 average, 676 sq ft and $305 per sq ft for its 2016–2019 Portland detached-ADU discussion. That is not a 2026 national average. Its costs include design, permits, utility connections, construction and the owner's estimated labor contribution, but exclude landscaping and furniture.
The source has an internal mismatch. Its 29 listed detached-new-construction rows total $5,239,000, giving a mean of $180,655, not the stated $180,833. Their mean area is 625 sq ft, not the stated 676. Both cost means round to $181,000, but the exact figures do not agree. The row-level download preserves the source totals and areas and recomputes each per-foot value; some printed per-foot values also differ.
The source separately reports $193,900 and $327 per sq ft for 10 detached ADUs on the 2019 tour. That cohort is not identified in the combined HTML table, so we retain those as the publisher's reported figures, not a mean we independently rebuilt. Scaling the $193,900 figure from the 2019 index gives about $290,000.
Which type of ADU costs the least?
Garage ADUs had the lowest median total in the California survey — $90,000, with an index-adjusted equivalent of about $137,000. Conversions inside the main home had the lowest cost per square foot: $173 reported, about $263 after the adjustment. Detached new builds had the highest median total among these types, $180,000, or about $274,000 after adjustment.
A garage conversion can reuse its slab, walls and roof when they are suitable. A detached cottage needs a new structure. That helps explain the cost difference, but the survey does not isolate savings from reuse or establish what work your garage will need.
| ADU type | Reported median total | Total ÷ per-foot median (sq ft)† | Reported per sq ft | Adjusted total | Adjusted per sq ft |
|---|---|---|---|---|---|
| Detached | $180,000 | 600 | $300 | $274,000 | $456 |
| Attached addition | $150,000 | 600 | $250 | $228,000 | $380 |
| Conversion inside the main home | $100,000 | 578 | $173 | $152,000 | $263 |
| Garage (conversions and expansions) | $90,000 | 476 | $189 | $137,000 | $288 |
| Source: UC Berkeley Center for Community Innovation (2021), Table 2; †The third column is only the ratio of two published medians, rounded to a whole square foot. It is not a measured median size. Survey fielded in 2020 for a mainly 2018–19 permit cohort. Adjusted figures: The Dwelling Index, September 29, 2026. | |||||
One catch on garages. The survey's "garage" group also includes garages that were expanded. The authors suggest that some owners might have used the permit process to legalize already converted space, but the survey did not ask that question. A new conversion therefore should not be priced as though the published median describes its scope.
The authors offer that as one possible explanation for a regional puzzle. Los Angeles County had the lowest median cost among the four reported regions, and garage conversions made up 39% of its surveyed ADUs, compared with 11% to 14% elsewhere. Those different project mixes are why we do not use the regional medians as price multipliers.
If you're weighing a factory-built unit instead, our comparison of prefab ADU companies lists what each price covers, and the garage conversion cost guide goes deeper on converting.
Does a bigger ADU cost more per square foot?
In the model, no — a bigger ADU costs more in total but less per square foot. Building an ADU's author pegged a 2019 Portland 800 sq ft example at $210,667 and a 400 sq ft example at $168,750. The larger estimate is 24.8% higher. Double the space, about a quarter more money in those two author-estimated examples.
Some costs do not rise in direct proportion to floor area: a larger unit does not always need another kitchen, set of plans or utility connection. A straight line through the two Portland estimates has a $126,833 starting amount plus $104.7925 per square foot (2019 dollars). Those are fitted model terms, not measured fixed costs or a priced list of work.
The calculator uses that curve for new builds and scales it to the California survey benchmark at a chosen 600 sq ft comparison size. Here is what the model gives; these are not observed size-group medians.
| Interior size | Model estimate | Per sq ft | Low scenario | High scenario |
|---|---|---|---|---|
| 400 sq ft | $243,000 | $609 | $162,000 | $325,000 |
| 500 sq ft | $259,000 | $517 | $172,000 | $345,000 |
| 600 sq ft | $274,000 | $456 | $182,000 | $365,000 |
| 750 sq ft | $296,000 | $395 | $198,000 | $395,000 |
| 800 sq ft | $304,000 | $380 | $203,000 | $405,000 |
| 1,000 sq ft | $334,000 | $334 | $223,000 | $446,000 |
| 1,200 sq ft | $364,000 | $304 | $243,000 | $486,000 |
| Source: The Dwelling Index starting estimates, September 2026, from UC Berkeley's detached median scaled by the Census index and the author-estimated size examples in Building an ADU's 2019 Portland data. Low scenario = estimate × 2/3; high scenario = estimate × 4/3 (see How we built this). These are illustrative cases, not quote bounds or a confidence interval. Size affects fees too — see the California section below. | ||||
In this model, going from 600 to 1,200 square feet doubles the space and adds about $90,000, a third more money. This extends the fitted curve beyond the original 400 and 800 sq ft examples. Per square foot, the price drops from $456 to $304. For more on the smallest sizes, see our 400 sq ft and 600 sq ft cost guides.
What does a building price leave out?
In all four single-unit rows of SnapADU's March 2026 San Diego price table, the all-in budget ran $75,000 to $90,000 above the building price — 25.0% to 36.4% more. The building price covers the unit itself: foundation slab, structure and standard finishes. The rest pays for design, permits, sitework and utilities.
This is where budgets go wrong. A building price of $220,000 can be accurate and still sit $80,000 below the full budget.
| Size and layout | Building price | All-in budget | Difference | Difference as % of building price | Difference as % of all-in budget |
|---|---|---|---|---|---|
| 500 sq ft, 1 bed / 1 bath | $220,000 | $300,000 | $80,000 | 36.4% | 26.7% |
| 750 sq ft, 2 bed / 1 bath | $275,000 | $350,000 | $75,000 | 27.3% | 21.4% |
| 1,000 sq ft, 2 bed / 2 bath | $335,000 | $425,000 | $90,000 | 26.9% | 21.2% |
| 1,200 sq ft, 3 bed / 2 bath | $360,000 | $450,000 | $90,000 | 25.0% | 20.0% |
| Source: SnapADU, "Cost to Build an ADU in San Diego," table updated March 2026 — published builder prices, not audited finished jobs. Differences and percentages: The Dwelling Index, September 2026. The firm's separate two-ADU row is left out because it prices two units. | |||||
Watch the last two columns. The same $80,000 is 36.4% of the building price but 26.7% of the full budget. When someone says "add 30%," ask: 30% of what?
The firm spells out part of the gap. It lists $35,000 for basic site work and general conditions on a level, easy-to-reach lot — trenching and connecting utilities, finish grading, site protection and testing. It suggests budgeting $10 to $20 per square foot for permit fees, and says those range from $2 to $4 per square foot in Encinitas to $13 to $28 in the City of San Diego. Those per-foot fee figures are the builder's estimates, not official city fee schedules. Grading, retaining walls, stormwater work and solar, where required, can add more. Source: SnapADU.
That's why the calculator's Check a quote tab has 20 lines, from surveys and soils reports to trenching, panel upgrades and a reserve for surprises. You can download the same list as a blank worksheet in the data section. If you're in San Diego County, our San Diego County ADU builder guide covers what to ask each builder to include.
Why do ADUs cost more per square foot than a house?
The reported detached-ADU figure is about twice the house contract-price figure in these comparisons. UC Berkeley's $300-per-sq-ft detached median divided by $140.605—the average of the West's 2018 and 2019 annual medians—gives 2.13. Portland's publisher-reported 2019 mean of $327 divided by the West's $158.73 mean gives 2.06. Neither ratio isolates the cost of building small.
A larger house can spread a kitchen, bathrooms and hookups across more space. An ADU puts those features in a smaller area. That is a plausible cost driver, not proof that the full difference in these figures comes from size alone.
| Historical comparison | ADU per sq ft | House contract price per sq ft, West | Ratio |
|---|---|---|---|
| California survey median vs. average of West annual medians (2018–19) | $300.00 | $140.61 | 2.13× |
| Portland detached ADU average (2019) vs. West average contract price (2019) | $327.00 | $158.73 | 2.06× |
| Source: UC Berkeley CCI (2021); Building an ADU; U.S. Census Bureau, contract price per square foot of contractor-built houses (excludes the lot; West comparison = arithmetic mean of the 2018 $141.85 and 2019 $139.36 medians; it is not a pooled two-year median). Ratios: The Dwelling Index. | |||
The two sides don't count exactly the same things. The ADU figures are owner-project costs; Portland also counts estimated owner labor. Census contract prices exclude improved lot value, later change orders and separately contracted work. Census floor area uses exterior dimensions; the ADU data does not establish a matching area definition. So these are cross-scope comparisons, not a measured ADU markup. More on this in our ADU cost per square foot guide. (Census definitions.)
How much does an ADU cost in my part of the country?
Outside California, the illustrative model for a 600 sq ft detached ADU gives about $225,000 nationally, from about $206,000 in the South to about $254,000 in the Midwest. It combines Census prices for contractor-built houses with index scaling and California comparison ratios. These are modeled scenarios, not measured ADU prices or state-specific quotes.
This model does not use a measured ADU price series for each state. The state selector routes to Census regions, not a ZIP-code or local-price database. California uses a separate survey-based formula; the other regional outputs carry the model label.
| Region | Detached | Attached addition | Garage conversion | Conversion inside the home | Basis |
|---|---|---|---|---|---|
| California | $274,000 | $228,000 | $173,000 | $158,000 | Modeled from survey inputs |
| United States | $225,000 | $187,000 | $142,000 | $130,000 | Modeled |
| Northeast | $235,000 | $196,000 | $148,000 | $135,000 | Modeled |
| Midwest | $254,000 | $212,000 | $160,000 | $147,000 | Modeled |
| South | $206,000 | $172,000 | $130,000 | $119,000 | Modeled |
| West | $232,000 | $193,000 | $146,000 | $134,000 | Modeled |
| Source: The Dwelling Index starting estimates, September 2026. Modeled rows = Census 2025 median contract price per sq ft (U.S. $171.57; Northeast $179.30; Midwest $194.09; South $157.30; West $176.87) × the full-precision index factor (2416.1/12)/196.9 × an ADU-type comparison ratio from UC Berkeley and Census 2018–2019 data. Full method in How we built this. | |||||
Two limits matter here. First, applying California's cross-scope ratios elsewhere is a model assumption, not a measured national ADU premium. Second, the Midwest is highest among the four 2025 Census regional point estimates used here ($194.09 per sq ft). That does not establish a stable regional ranking or account for sampling uncertainty. The Census West aggregate includes California, even though the calculator routes California to its separate mode.
Table 8 compares the four San Diego benchmarks with our California model at the same sizes. It is a descriptive check, not a matched-project accuracy test: the source periods, markets and detailed scopes are not the same.
| Size | SnapADU all-in (San Diego, March 2026) | Our California detached estimate | Builder above ours by | Our high line |
|---|---|---|---|---|
| 500 sq ft | $300,000 | $259,000 | 15.8% | $345,000 |
| 750 sq ft | $350,000 | $296,000 | 18.2% | $395,000 |
| 1,000 sq ft | $425,000 | $334,000 | 27.2% | $446,000 |
| 1,200 sq ft | $450,000 | $364,000 | 23.6% | $486,000 |
| Source: SnapADU; The Dwelling Index starting estimates. Percentages use the rounded figures shown. | ||||
The four builder benchmarks run 15.8% to 27.2% above the model, and each is below its high scenario. Four unmatched benchmarks do not show where a future bid will land or how often the model will be close. The comparison does not establish why the figures differ.
A separate property-eligibility check can help organize planning questions. It does not replace verification of lot lines, easements, utility capacity or permit approval.
Does California waive ADU fees?
Partly. California bars local impact fees on ADUs with 750 square feet of interior livable space or less, and on junior ADUs of 500 square feet or less. ADUs under 500 square feet also owe no school fees. Larger ADUs need a school-district check; crossing 750 sq ft can also allow a proportional local impact fee. Other charges — permit and plan-check fees, and in some cases utility connection charges — are separate categories.
Here's how the rules stack up, straight from the statute:
- Impact fees (for parks, roads and similar public costs): $0 at 750 sq ft or less. Above 750, a city can charge, but only in proportion to your main home's size. As a proportional illustration, suppose the applicable city fee for a new house is $20,000, the ADU is 900 sq ft and the main home is 1,800 sq ft. The result is $10,000. Those are hypothetical inputs, not a local fee assessment. (Gov. Code §66311.5(c)(1))
- School fees: the specific ADU exemption applies below 500 sq ft. At 500 sq ft or above, the district must check the project type and assessable space. Education Code §17620 treats new residential construction differently from other residential construction; the latter needs a net increase greater than 500 sq ft. The 2026 maximum Level 1 rate is $5.38 per assessable sq ft, up from $5.17. Other fee levels can apply, so $5.38 is not a universal cap. (Gov. Code §66311.5(c)(3); Ed. Code §17620; State Allocation Board, Jan. 28, 2026).
- Utility connections: for water and sewer connection fees, an ADU is not treated as a new residential use unless built with a new single-family home. For qualifying units under §66323(a)(1), a new separate connection and related fee cannot be required unless the ADU is built with a new single-family home or separately conveyed under §66342. Other ADUs can require a connection, with a charge proportionate to the burden and no greater than the reasonable cost of service. The protection does not make the physical utility work free. (Gov. Code §66311.5(b), (d), (e); §66323).
| ADU interior size | School-fee example at $5.38† | Local impact-fee category |
|---|---|---|
| 400 sq ft | $0 | $0 |
| 499 sq ft | $0 | $0 |
| 500 sq ft | $2,690 only if chargeable† | $0 |
| 600 sq ft | $3,228 | $0 |
| 750 sq ft | $4,035 | $0 |
| 800 sq ft | $4,304 | May apply (proportional) |
| 1,000 sq ft | $5,380 | May apply (proportional) |
| 1,200 sq ft | $6,456 | May apply (proportional) |
| Source: Gov. Code §66311.5; State Allocation Board, Jan. 28, 2026. †For rows of 500 sq ft or more, the arithmetic assumes the district has confirmed a chargeable project and assessable area equal to the displayed size. At exactly 500, an increase classified as other residential construction does not exceed the statutory threshold. Interior area does not automatically equal assessable area. District rates may be lower, and other fee levels may apply. Math: The Dwelling Index. These are not maximum bills for every project. | ||
The 750-sq-ft local impact-fee exemption and the school-fee rules are separate. At $5.38, 50 additional chargeable square feet would add $269 in a Level 1 example. But the fee does not automatically jump by $2,690 when a design goes from 499 to 500 sq ft; classification and assessable area must be checked. Do not design around a fee saving the district has not confirmed.
As of September 29, 2026, the official record lists SB 1117 as enrolled and with the Governor, presented August 30. Its enrolled text would apply the above-750 impact-fee calculation to properties with up to two ADUs, rather than charging on the whole ADU area. It does not mean the first two ADUs on a lot with any number of units. The Governor's deadline is September 30, 2026. The proposed calculator switch stays off unless an enacted version, effective date and applicable projects are verified. (Official status; enrolled text; Senate deadline.
For city-by-city fee cuts, see our ADU fee waiver tracker. For the rest of the state rules, see California ADU laws.
How do most people pay for an ADU?
In UC Berkeley's 2020 survey, 52% of 694 financing respondents used cash, and the report says 62% relied at least partly on savings or money from a friend or relative. Owners could name more than one source. These describe the surveyed California owners, not how most owners finance an ADU now. (Figure 7 and text.)
The bank-loan share has a source conflict: Figure 7 reports 43%, but Appendix B lists 269 bank-loan responses and the figure states 694 respondents; 269 ÷ 694 is 38.8%. We show the mismatch instead of choosing a new rate. The report's 66% HELOC share among bank borrowers agrees with its 177 HELOC responses divided by 269 bank-loan responses, rounded. A HELOC is a line of credit secured by home equity. (Figure 7; counts; loan types.)
The index-adjusted median benchmark is about $78,000 above the reported $150,000 median ($228,000 minus $150,000, rounded). That difference is index arithmetic, not a measured increase in what the same homeowners must borrow.
Once you have a budget, compare ADU financing options to see which questions to take to a lender.
Why do these numbers matter now?
The Census construction index remains above the 2018–19 baseline, but it has fallen from its April 2026 high. It reached 208.2 in April and 199.8 in August (preliminary), a 4.0% decline. Its September 2025–August 2026 average is still 52.1% above the chosen baseline. (Census series.)
California's rules also moved this year. The school-fee exemption for ADUs under 500 sq ft took effect January 1, 2026, and the state maximum Level 1 school-fee rate rose 4.06% on January 28, 2026. SB 1117 is waiting on the Governor.
A budget needs both a stated price basis and the fee rules that actually apply. Neither an old median nor a national index can settle a local quote.
How did we build this calculator?
We checked four kinds of evidence on September 29, 2026, then recomputed the tables, scenarios and charts. We distinguished published values from our calculations, model choices and unresolved source conflicts:
- What owners reported and authors estimated. UC Berkeley's 2020 survey medians by type and region, from a mainly 2018–2019 permit/occupancy cohort (Table 2), and Building an ADU's owner-reported figures and author-estimated Portland size examples for 2016–2019.
- How prices changed. The Census Bureau's constant-quality price index for new single-family houses under construction (excludes land), and its median contract price per square foot of contractor-built houses by region.
- Published budget scope. SnapADU's San Diego price table (March 2026) and NAHB's 2024 construction cost breakdown.
- California fee rules. Gov. Code §66311.5, §66323, Ed. Code §17620 and the State Allocation Board's 2026 rate.
Then we did the math:
- Index adjustment. The chosen 2018–2019 baseline is (130.4 + 134.4) ÷ 2 = 132.4. The 12 monthly values from September 2025 through August 2026 sum to 2,416.1; their mean is 201.341666…. The factor is (2,416.1 ÷ 12) ÷ 132.4 = 1.520707452…. Thus $150,000 becomes $228,106 before rounding. Portland's 2019 figures use the same current average divided by 134.4. Permit/cohort years are not verified spending dates; the equal-year baseline and applying this construction index to a whole owner budget are assumptions.
- Outside California. Multiply the Census 2025 regional median per sq ft by (2,416.1 ÷ 12) ÷ 196.9, then by the California type median per sq ft divided by 140.605. That denominator is (141.85 + 139.36) ÷ 2, the arithmetic mean of two annual West medians—not a pooled median. These are cross-scope ratios used as model choices, not measured state ADU multipliers.
- Size. From the author's 2019 Portland estimates, V = (210,667 − 168,750) ÷ 400 = 104.7925 and F = 168,750 − 400V = 126,833. At a chosen 600 sq ft anchor, S = F ÷ (F + 600V) = 126,833 ÷ 189,708.5 ≈ 0.668567829. For detached builds and additions, E = P × 600 × [S + (1 − S) × A ÷ 600], where P is the modeled per-foot base and A is area. For conversions, E = P × A, a separate linear assumption. F and V are curve terms, not measured bills.
- Low and high scenarios. These are E × 2/3 and E × 4/3. UC Berkeley's appendix places 37% in its band through $100,000 and 34% from $100,001 through $200,000; another 29% is above $200,000. These pooled historical bands do not establish likely bounds for a type, size or region. The source narrative says “less than” at the cutoffs, while the appendix bands have inclusive upper endpoints; we use the appendix's stated bands, not an inferred continuous probability.
- Builder comparisons. Include all four single-unit rows in SnapADU's March 2026 table; exclude its separate two-unit row. Difference = listed all-in budget minus vertical-build price. Divide that difference by the named denominator for each percentage. Table 8 deliberately compares display-rounded model amounts. The source's 750-sq-ft per-foot labels are approximate: we calculate $350,000 ÷ 750 as $466.7, rather than copying its $465 label.
- Source conflicts. The survey’s executive summary prints 53% cash financing, while Figure 7 prints 52%; its 363 cash responses divided by 694 respondents round to 52%. The Portland row audit includes all 29 listed detached-new-construction records, not above-garage units. Their mean is $5,239,000 ÷ 29 = $180,655.17; their mean area is 18,121 ÷ 29 = 624.8621 sq ft. The separate 2019 ten-project mean remains publisher-reported. UC Berkeley's bank-share mismatch is shown in How people pay. Its narrative also gives Los Angeles County $223.04 per sq ft and calls garages lowest per foot; Table 2 instead gives Los Angeles $197.22 and internal conversions $173.04 versus garages $189.19. We use the table's labeled rows and retain the discrepancy here.
- Rounding. Keep full precision through every calculation. Round totals to the nearest $1,000, per-foot figures to $1 and displayed percentages as labeled, half up. CSV columns ending in
_unroundedpreserve cents for inspection; despite their legacy names, they are not full-precision operands. Fields beginningtoday_mean an index-adjusted historical benchmark, not a measured current price.
To reproduce any number, download the parameters file, which lists every input with its source and check date. Our research methods are on the research methodology page, and more ADU numbers are in our ADU statistics.
Editorial responsibility for The Dwelling Index rests with Kaden Coziar, Founder and Responsible Editor (editorial team). Spot an error? Our corrections page explains how we fix it.
What changed: September 29, 2026 — checked the source data, clarified the index-adjusted benchmarks and model limits, corrected fee examples, and added complete reproducible downloads.
What does this data show, and what doesn't it?
It shows reported historical ADU costs, index-adjusted benchmarks, transparent model scenarios and one San Diego builder's published price list. The model lets you explore assumptions. The quote worksheet checks whether your own budget has missing or double-counted costs.
It doesn't show:
- A measured 2026 ADU median. Our adjusted figures scale historical survey values; they do not come from a new owner survey. We are not claiming that no newer survey exists.
- ADU-specific inflation or exact expenditure years. The national index covers new single-family construction, not every fee or owner cost. The 2018–19 baseline is an assumption based on the permit/occupancy cohort; the owners were surveyed in 2020.
- Your lot or a validated prediction range. Slope, soil, distance to the sewer line, scope and fees are not measured for your project. A real quote can fall outside both model scenarios.
- Measured regional ADU prices for the modeled rows. Even the California size-specific outputs are model scenarios, not observed medians for each size.
- Identical included work. The California source excludes land but does not separately establish a landscaping or furniture exclusion. Portland expressly excludes both and includes estimated owner labor. NAHB’s separate house-construction reference includes landscaping. Check each source’s scope rather than assuming a common bundle.
Treat the model as a way to test assumptions, not a bid or an assessment of a contractor’s fairness. For an actual project budget, enter written quotes and keep missing costs visible.
How do I cite this page?
The Dwelling Index. (2026, September 29). ADU Cost Calculator: A 20-Line Budget With Sources. https://dwellingindex.com/adu-cost-calculator/
Quoting the headline number? Keep its place and period:
California's published $150,000 ADU survey median becomes about $228,000 when scaled by the Census construction-price index from a 2018–19 baseline to September 2025–August 2026, according to The Dwelling Index's September 29, 2026 analysis. This is an index-adjusted benchmark, not a measured 2026 median.
Each table, key statistic and section has a stable address, such as #table-1, #table-5 and #stat-headline-benchmark. Keep the source period and the words “index-adjusted benchmark” with the number.
You may reuse The Dwelling Index's original calculations and chart designs with credit by name to The Dwelling Index; preserve all underlying source attribution and applicable terms. This permission does not license third-party material, and no link is required.
Where can I download the data?
Every file is free, with no form. Source rows carry a link and check date; model choices and the worksheet’s hypothetical example are labeled as such.
- adu-cost-benchmarks-adjusted.csv — 14 records: nine reported medians, two historical cost-band boundaries, one reported Portland mean and two author-estimated size examples, with index adjustments.
- adu-building-price-vs-all-in-san-diego.csv — the San Diego building price vs. all-in comparison and our reality check.
- adu-census-construction-price-index.csv — the Census index values we used.
- adu-cost-calculator-parameters.csv — source inputs and stated model choices, with dates and formulas.
- adu-starting-estimates-2026-09.csv — all 156 supplied sample scenarios, covering every region and type and the listed preset sizes; other valid whole-number sizes use the same formula.
- adu-budget-scope-checklist.csv — a blank 20-line worksheet plus a separately marked hypothetical example that must not be imported as a price.
- adu-census-contract-price-per-square-foot.csv — 30 source values used to check the historical and regional comparisons.
- adu-portland-visible-projects.csv — all 29 listed detached-project records behind the source-mean check.
- adu-financing-source-check.csv — source percentages, counts and the unresolved bank-share mismatch.
- adu-california-fee-examples-2026-09.csv — the eight conditional Level 1 examples and their scope rules.
Where can I read more about ADU costs?
- How much does an ADU cost? — 2026 ranges by type, size and region
- ADU cost per square foot — why per-foot prices vary
- Prefab ADU cost — factory-built pricing, delivery and install
- 400 sq ft ADU cost — a budget breakdown for small units
- Garage conversion ADU cost — converting space you already have
ADU cost calculator FAQ
How much would it cost to build a 600 square foot ADU? About $274,000 in the illustrative California detached model, or $225,000 in the national model. A 600 sq ft garage conversion model gives about $173,000 in California and $142,000 nationally. These are not measured medians for 600 sq ft units or current quotes. Source inputs and formula.
How much does it cost to build a 1,000 sq ft ADU in California? About $334,000 in the California detached model, with illustrative low/high cases of $223,000 and $446,000. SnapADU's March 2026 San Diego table separately lists $425,000 all-in. A chargeable 1,000-assessable-sq-ft school-fee example at the $5.38 Level 1 rate is $5,380; it is not a universal fee maximum. Model; builder source; fee conditions.
How much does it cost to build a 1,200 sq ft ADU in California? About $364,000 in the California detached model, with illustrative low/high cases of $243,000 and $486,000. SnapADU separately lists $450,000 all-in for 1,200 sq ft in its March 2026 San Diego table. A chargeable 1,200-assessable-sq-ft example at the $5.38 Level 1 rate is $6,456, not a cap on every assessment. Model; builder source; fee conditions.
What is the cheapest way to build an ADU? Garage conversions and expansions had the lowest total median in UC Berkeley's California survey: $90,000, or about $137,000 after index scaling. Internal conversions had the lowest reported median per-foot cost: $173, or about $263 after scaling. Detached new builds had a $180,000 median, about $274,000 after scaling. That comparison does not settle which option is cheapest for your property's condition and scope. Source and limits.
Is it cheaper to build an ADU or a home addition? We don't have matched prices for regular home additions, so we can't say. In the California ADU survey, additions to the main home had a $150,000 median versus $180,000 for detached ADUs—index-adjusted equivalents of about $228,000 and $274,000. Source and comparison.
How much does an ADU cost in 2026? The $228,000 headline is an index-adjusted California survey benchmark, not a measured 2026 median. The corresponding detached and garage benchmarks are about $274,000 and $137,000. For a specified 600 sq ft detached unit, the separate illustrative national model gives about $225,000. Benchmark data; regional model.
How do you calculate the cost of an ADU? For this model, start with the stated historical or regional input, apply the construction-index factor and the explicit size assumption, then calculate the two illustrative scenarios. For an actual budget, enter written prices and check fees, utilities, site work and reserve without double-counting packages. Unknown costs stay unpriced. Full formula; quote worksheet.
How much does an ADU cost per square foot? The California survey's reported median was $250 per sq ft, with an index-adjusted equivalent of about $380. Detached ADUs were $300 (about $456 after scaling), and garage conversions or expansions $189.19 (about $288 after scaling). These are historical survey benchmarks, not measured 2026 prices; per-foot changes by size in the calculator come from its model. Source table.
Do the estimates include permits and utilities? The California survey counted total owner spending including design, labor, materials and permits; it did not give a complete separate utility or landscaping allowance. Portland expressly included utility connections and estimated owner labor, while excluding landscaping and furniture. The quote worksheet has separate fee and utility lines so you can confirm what a package covers. Source scopes.
Are California ADUs of 750 square feet exempt from fees? From local impact fees, yes—the exemption includes exactly 750 square feet of interior livable space. Not from everything: school fees need their own project-classification and assessable-area check, while permit and utility charges follow separate rules. Current statute and fee examples.
What are the downsides of an ADU, cost-wise? A building price can leave out a large part of the budget: the four San Diego examples add $75,000–$90,000 beyond the structure price. ADU-versus-house per-foot comparisons also have different cost scopes, and neither a national index nor a model prices your lot's utilities or required work. In the 2020 California survey, 52% of financing respondents used cash. Budget comparison; cost scopes; financing source.
Do I have to give my email? No email or account is needed to read this page's source tables or download its data. The files are provided without a form.
Sources
- UC Berkeley Center for Community Innovation, Implementing the Backyard Revolution: Perspectives of California's ADU Owners (April 2021), Table 2 and Figure 7. https://www.aducalifornia.org/wp-content/uploads/2021/04/Implementing-the-Backyard-Revolution.pdf — checked Sept. 29, 2026.
- Terner Center for Housing Innovation, "First Ever Statewide ADU Owner Survey Shows Growth, Room for Improvement" (April 22, 2021). https://ternercenter.berkeley.edu/blog/cci-adu-survey/ — checked Sept. 29, 2026.
- U.S. Census Bureau/HUD, Survey of Construction, Price Indexes of New Single-Family Houses Under Construction (data through August 2026). https://www.census.gov/construction/nrs/xls/price_uc_cust.xlsx — checked Sept. 29, 2026.
- U.S. Census Bureau, Characteristics of New Housing, Median and Average Contract Price per Square Foot of New Contractor-Built Single-Family Houses Started (2025 data). https://www.census.gov/construction/chars/xls/contractpricesqft_cust.xls — checked Sept. 29, 2026.
- Building an ADU (Kol Peterson), "Calculating the Costs of Accessory Dwelling Units" (Portland data, 2016–2019). https://www.buildinganadu.com/cost-of-building-an-adu — checked Sept. 29, 2026.
- SnapADU, "Cost to Build an ADU in San Diego" (table updated March 2026). https://snapadu.com/adu-costs/ — checked Sept. 29, 2026.
- National Association of Home Builders, "Cost of Constructing a Home – 2024" (Jan. 20, 2025). https://www.nahb.org/news-and-economics/housing-economics-plus/special-studies/special-studies-pages/cost-of-constructing-a-home-in-2024 — checked Sept. 29, 2026.
- California Government Code §66311.5 (effective Jan. 1, 2026). https://leginfo.legislature.ca.gov/faces/codes_displaySection.xhtml?lawCode=GOV§ionNum=66311.5. — checked Sept. 29, 2026.
- California Government Code §66323. https://leginfo.legislature.ca.gov/faces/codes_displaySection.xhtml?lawCode=GOV§ionNum=66323. — checked Sept. 29, 2026.
- California Education Code §17620. https://leginfo.legislature.ca.gov/faces/codes_displaySection.xhtml?lawCode=EDC§ionNum=17620. — checked Sept. 29, 2026.
- State Allocation Board, "Index Adjustment on the Assessment for Development" (Jan. 28, 2026). https://www.dgs.ca.gov/-/media/Divisions/OPSC/Resources/CCI-Adjustments/01282026_Index-Adjustment-on-Development_Approved_FINAL.pdf — checked Sept. 29, 2026.
- California Legislature, SB 1117 (2025–2026 session), official status and enrolled text — checked Sept. 29, 2026; enrolled/pending in the retrieved record, not an enacted rule.
- Revival Homes, "ADU Budget Calculator" (contingency guidance). https://www.revivaladu.com/financing/budget-calculator — checked Sept. 29, 2026.
- U.S. Census Bureau, Description of the price index for houses under construction — checked Sept. 29, 2026.
- U.S. Census Bureau, Survey of Construction definitions and methodology/release timing — checked Sept. 29, 2026.
- California Senate, 2026 legislative deadlines — checked Sept. 29, 2026.