ADU Equity Calculator: Estimate Value, Rent, and Your Real Financing Gap
By The Dwelling Index Editorial Team · Last updated: · Last verified: May 20, 2026 · Methodology · Editorial Team
The 60-second answer
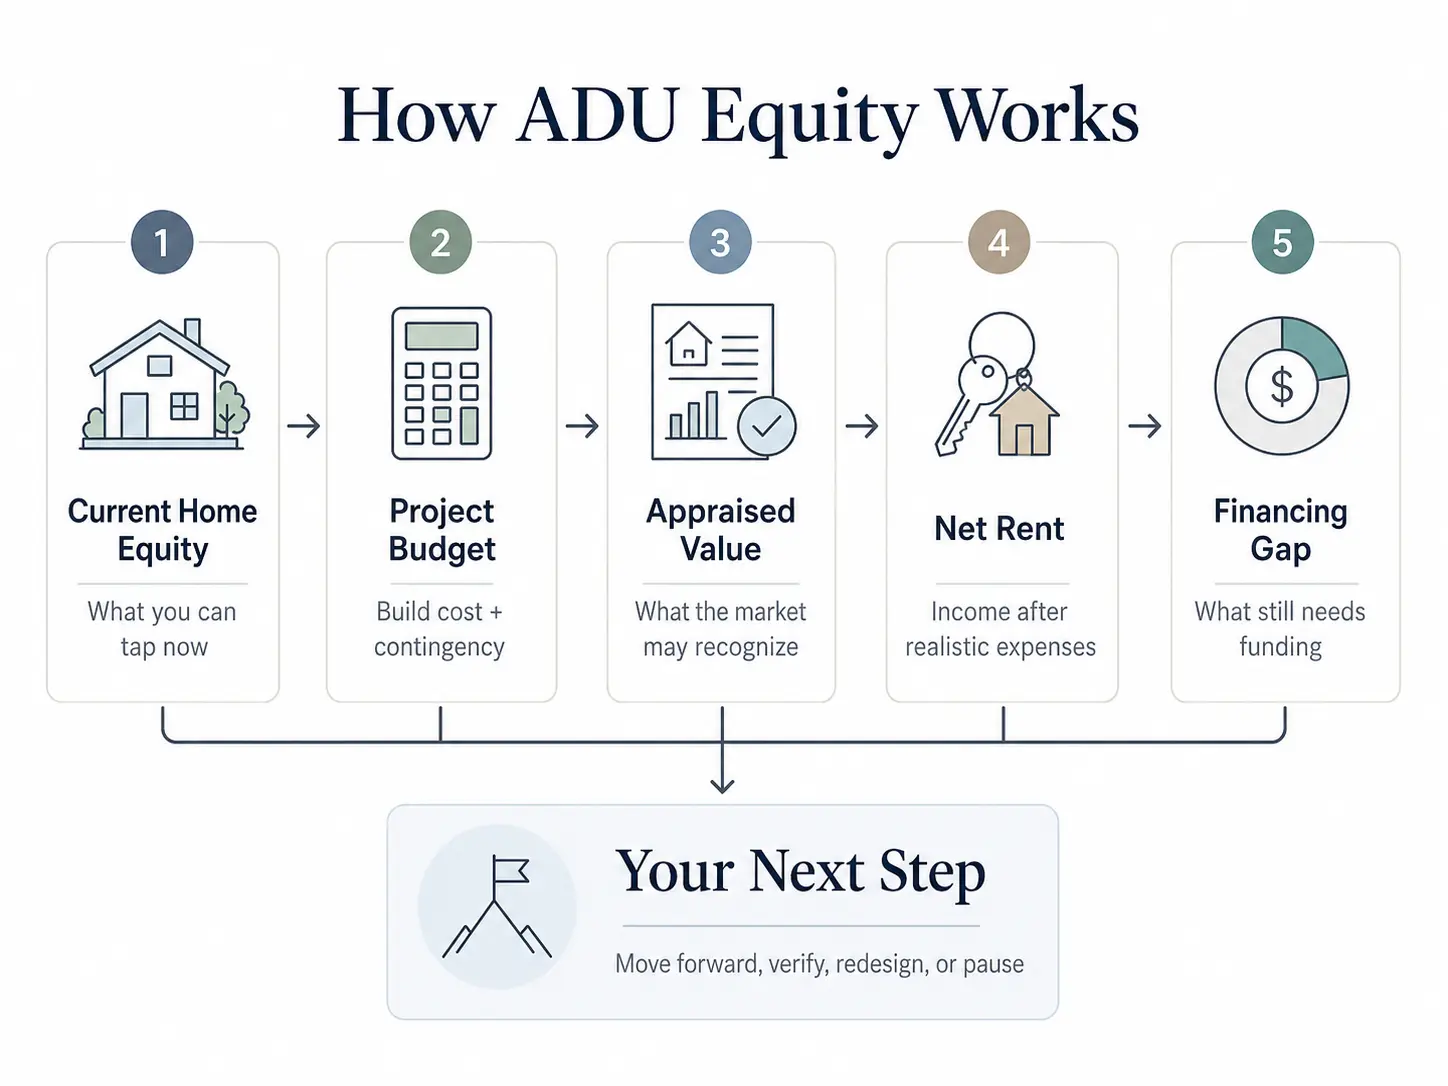
An honest ADU equity calculator should never promise a fixed percentage jump in your home’s value. The version we built answers four questions in order: how much tappable home equity you have right now, what the ADU will really cost with contingency, what an appraiser is likely to credit you on the next appraisal, and whether long-term rent can close the rest of the gap.
Bottom line for most U.S. homeowners. In mature ADU-comp markets, a permitted, well-built ADU can support a meaningful appraisal premium — but there is no verified national 15%–35% rule. Federal Housing Finance Agency data for California shows the median appraised value of single-family properties with ADUs was $1,064,000 in 2023 vs $715,000 without, and annualized appraisal growth ran 9.34% with ADUs vs 7.65% without from 2013–2023 (FHFA blog, accessed May 20, 2026). That supports California as a mature-comp benchmark — it does not prove a 22% national premium. In markets without strong ADU comps, working appraisers often default to a contributory value of $25,000–$50,000 regardless of build cost (JVM Lending, updated June 14, 2024). This calculator uses conservative, base, and optimistic scenarios so the result holds up in either case.
Illustrative estimates only. Not guarantees of appraised value, loan approval, rental income, or returns.
Run the calculator on this page, then use the section that matches your result — green (move forward), yellow (verify before you spend), or red (redesign or pause).
Use the ADU Equity Calculator + Rent Fit Tool
Answer capsule. Enter your home value, mortgage balance, ADU type, estimated budget, region, expected rent, and financing preference. The calculator returns your current equity room, ADU cost risk, a HUD-anchored rent baseline, three value scenarios, your financing gap, and a clear next step.
ADU Equity + Rent Fit Calculator
Illustrative estimates only — not guarantees of appraised value, loan approval, rental income, or returns.
How the calculator works (formula reference)
Tappable equity = Home Value × CLTV cap − Mortgage Balance
Budget with contingency = Build Cost × (1 + Contingency %)
Financing gap = Budget − Tappable Equity (floor: $0)
Conservative contrib = max($37,500, Home Value × regional low band × ADU type multiplier)
Base contrib = Home Value × regional mid band × ADU type multiplier
Annual net rent = Monthly rent × 12 × 0.95 occupancy × 0.70 net-to-owner
Gross payback = Budget ÷ Annual gross rent
Net payback = Budget ÷ Annual net rent
Year-N home equity change ≈ Base appraisal contrib − closing costs + cumulative net rent − cumulative property-tax delta
Got a result? The next step is a property-specific feasibility check that verifies whether your lot, setbacks, parking, and utility hookups support the ADU type you ran through the calculator.
Check your address → Get Your Free ADU ReportA word on the most common ADU equity mistake
We built this page because most of the calculators we found quietly blur two different numbers — added property value and net homeowner equity — and the gap between them can be tens of thousands of dollars.
Most tools take your home value, multiply it by 25% or 30%, and call that your equity gain. That is not what an appraiser writes on a report, and it is not what shows up in your refinance proceeds. The five-line model below separates value, debt, taxes, and rent because lenders and appraisers treat them differently:
Net Equity Gain (Year N)  =  (After-Completion Appraised Value − Pre-Build Value)
                          −  Loan Principal Balance at Year N
                          −  Closing Costs
                          −  Cumulative Property-Tax Delta at Year N
                          +  Cumulative Net Rental Income at Year N (if rented)
Most simple ADU calculators stop at line 1. This calculator runs all five — and, importantly, separates property equity change from project net position, because those two numbers behave very differently when you build with cash vs. debt.
What the calculator actually calculates
Answer capsule. A good ADU equity calculator separates five numbers: your current tappable equity, your total ADU budget with contingency, the appraiser-recognized value contribution, your rent-payback potential, and the remaining financing gap. It should not collapse all of these into a single “ROI” score, because lenders, appraisers, and tax assessors treat each one differently.
The five calculations, explained
We treat each as a separate lever because each one can independently break the math.
1. Current tappable equity.
Home Value × Target CLTV − Current Mortgage BalanceCLTV — combined loan-to-value — is the ratio of your total mortgage debt to your home value. Most lenders cap HELOCs and home equity loans at 80% to 85% CLTV; some renovation loans go higher against the after-completion value. If your home is worth $700,000, your existing mortgage balance is $400,000, and your lender’s CLTV cap is 80%, your tappable equity is ($700,000 × 0.80) − $400,000 = $160,000.
2. ADU project budget with contingency.
Hard Costs + Soft Costs + Utility/Site Work + Permits + ContingencyHard costs are the build itself: foundation, framing, roof, finishes. Soft costs are design, engineering, permit fees, and impact fees. Utility and site work cover sewer laterals, electrical panel upgrades, trenching, drainage, and grading — the line items that surprise most homeowners. Contingency is a buffer for the changes that will happen. We recommend 10% to 20% for new detached ADUs and 15% to 25% for conversions, where existing conditions are unknown until walls open up.
3. Appraiser-recognized value contribution.
The most-mistaken input in the entire ADU-equity question. We treat this as a scenario range, not a single number, because the answer depends on whether your market has ADU comparable sales mature enough for an appraiser to use the sales-comparison approach. See How much equity an ADU actually adds.
4. Rent-payback estimate.
Project Cost ÷ Annual Net RentNet rent — not gross rent — is what matters. Subtract vacancy reserve (5% to 10%), management (8% to 10% if you use a manager), insurance, taxes, utilities you cover, and a maintenance reserve (5% to 10% of rent). What’s left is what actually pays the loan.
5. Financing gap.
Project Budget − Available Cash − Available Loan ProceedsIf this number is positive, you have a gap. The gap doesn’t kill the project — it changes the financing path. See What if I don’t have enough equity?
Why Fannie Mae says this matters
Fannie Mae’s Selling Guide treats an ADU as separate from the primary dwelling’s finished living area unless the ADU is contained within or part of the primary dwelling with interior access. The appraiser describes it separately and analyzes its contribution to value and marketability on its own (Fannie Mae Selling Guide B4-1.3-05, accessed May 20, 2026). In plain English: the appraiser is not going to take your home’s price per square foot and multiply it across the ADU’s square footage. The ADU gets its own line on the report, and its value is set against comparable sales of homes with ADUs — when those comps exist.
One more Fannie Mae rule worth knowing before you spend a dollar on plans: for Fannie Mae one-unit property eligibility, only one ADU is permitted on the parcel of the primary one-unit dwelling, and ADUs are not permitted with a two- to four-unit dwelling (Fannie Mae Selling Guide B2-3-04, accessed May 20, 2026).
Property value, home equity, or net worth?
Answer capsule. “ADU equity” can mean three different things. Added property value is what an appraiser writes on the next report. Home equity is property value minus all your home-secured debt. Project net position is whether the dollars you put into the build (cash and debt combined) plus cumulative net rent have come back out the other side.
The five things people commonly mean when they say “ADU equity”:
- Added property value. The appraiser-recognized value contribution from the ADU on the next appraisal. This is what most calculators show — by itself, it’s misleading.
- Home equity after completion.
After-Completion Appraised Value − Total Home-Secured Debt. This is what shows up on your refinance underwriting. - Project net position.
Appraiser-Recognized Value − Cash Spent − Closing Costs − Tax/Insurance Delta + Cumulative Net Rent. This is whether the project itself has paid back the dollars you put into it. - Rental payback. Years for net rent to recover total project cost. Useful as a sanity check, not as a return.
- Lender-counted qualifying income. What a Fannie- or Freddie-backed lender will count toward your DTI. Different rules; covered below.
How much equity an ADU actually adds, by region
Answer capsule. There is no verified national “ADUs add 15–35%” rule. FHFA’s California UAD data shows single-family purchase appraisals with ADUs had a 2023 median appraised value of $1,064,000 vs. $715,000 without, with annualized median-value growth of 9.34% vs. 7.65% from 2013–2023 — that supports California as a mature-comp benchmark, not a national percentage premium. In markets without strong ADU comps, appraisers often default to a contributory value of $25,000–$50,000 regardless of build cost.
What FHFA actually says (and doesn’t)
The Federal Housing Finance Agency’s January 2025 blog post on California ADU appraisal data — drawn from the Uniform Appraisal Dataset for Enterprise-backed single-family purchase appraisals — reports two specific findings:
- 2023 median appraised value: $1,064,000 with an ADU vs. $715,000 without an ADU.
- Annualized median-value growth, 2013–2023: 9.34% with an ADU vs. 7.65% without.
FHFA explicitly frames these as descriptive statistics that “require further analysis,” not as a proven causal “ADU premium.” The data is California-only, excludes construction-loan appraisals, and counts only Enterprise-backed (Fannie/Freddie) purchases. Several outlets summarize the figures as a “22% appraisal premium” — that is their math, not FHFA’s claim. We cite the raw FHFA numbers and leave the percentage framing out. Source: FHFA, “Trends in Median Appraised Value for Properties With Accessory Dwelling Units in California,” fhfa.gov/blog, accessed May 20, 2026.
Editorial scenario bands (not verified appraisal premiums)
The table below is the calculator’s editorial scenario logic — not a published dataset. California rows are anchored to FHFA UAD evidence; non-California rows reflect lender commentary, ADU permitting volume, and the Terner Center’s regional context, and are marked accordingly.
| Region | Editorial scenario band | ADU comp maturity | Risk of $25K–$50K appraiser default | Anchor |
|---|---|---|---|---|
| California (coastal metros) | 22–35% scenario range | Mature | Low | FHFA UAD 2023 |
| California (Central Valley / inland) | 15–25% scenario range | Moderate | Moderate | FHFA UAD 2023 |
| Pacific Northwest (Portland, Seattle metros) | 15–30% scenario range | Moderate–Mature | Moderate | Terner Center; Portland Equity Study |
| Mountain West (UT, CO, AZ metros) | 15–25% scenario range — NEEDS VERIFICATION | Emerging | Moderate | Industry estimates |
| Northeast (NY, NJ, MA, CT) | 15–25% scenario range — NEEDS VERIFICATION | Emerging | Moderate–High | Industry estimates |
| Southeast (FL, GA, TX, NC) | 10–25% scenario range — NEEDS VERIFICATION | Early | High | NAR market data; limited comp sales |
| Midwest | 10–20% scenario range — NEEDS VERIFICATION | Early | High | Industry estimates |
California has the strongest public appraisal dataset we could verify for ADU properties. A few Pacific Northwest metros also have more developed ADU comp markets, but comparable-sales depth still varies by neighborhood. Non-California bands above are editorial scenarios used by the calculator — not verified appraisal premiums.
Other anchor sources for the calculator’s logic
- Porch.com listing-price analysis (republished via NFM Lending, Paces Funding, NAR coverage): homes with ADUs were listed approximately 35% higher on average in major cities. This is asking-price evidence, not appraisal value or a guaranteed equity increase.
- UC Berkeley Terner Center, “ADU Equity” (August 2022): regional appraisal premium varies materially with state legal regime and comp density.
- Portland Equity Study (Kol Peterson, 14 permitted ADUs): income-based valuation produced appraisals 7.2–9.8% higher than sales prices; ADUs contributed roughly 30% of total property value in the studied set.
- JVM Lending working-appraiser commentary (updated June 14, 2024): when ADU comparables don’t exist, appraisers commonly default to $25,000–$50,000 contributory value regardless of build cost.
Why “X% of home value” calculators are risky
A fixed-percentage calculator is easy to understand and dangerous to use. The same $300,000 detached ADU can:
- Appraise at or above cost in coastal California, where comps exist and the FHFA-anchored band holds.
- Appraise at $150,000 in a Southeastern metro where you’re the first ADU on the block.
- Appraise at $25,000–$50,000 in any market if it’s unpermitted or zoning-noncompliant.
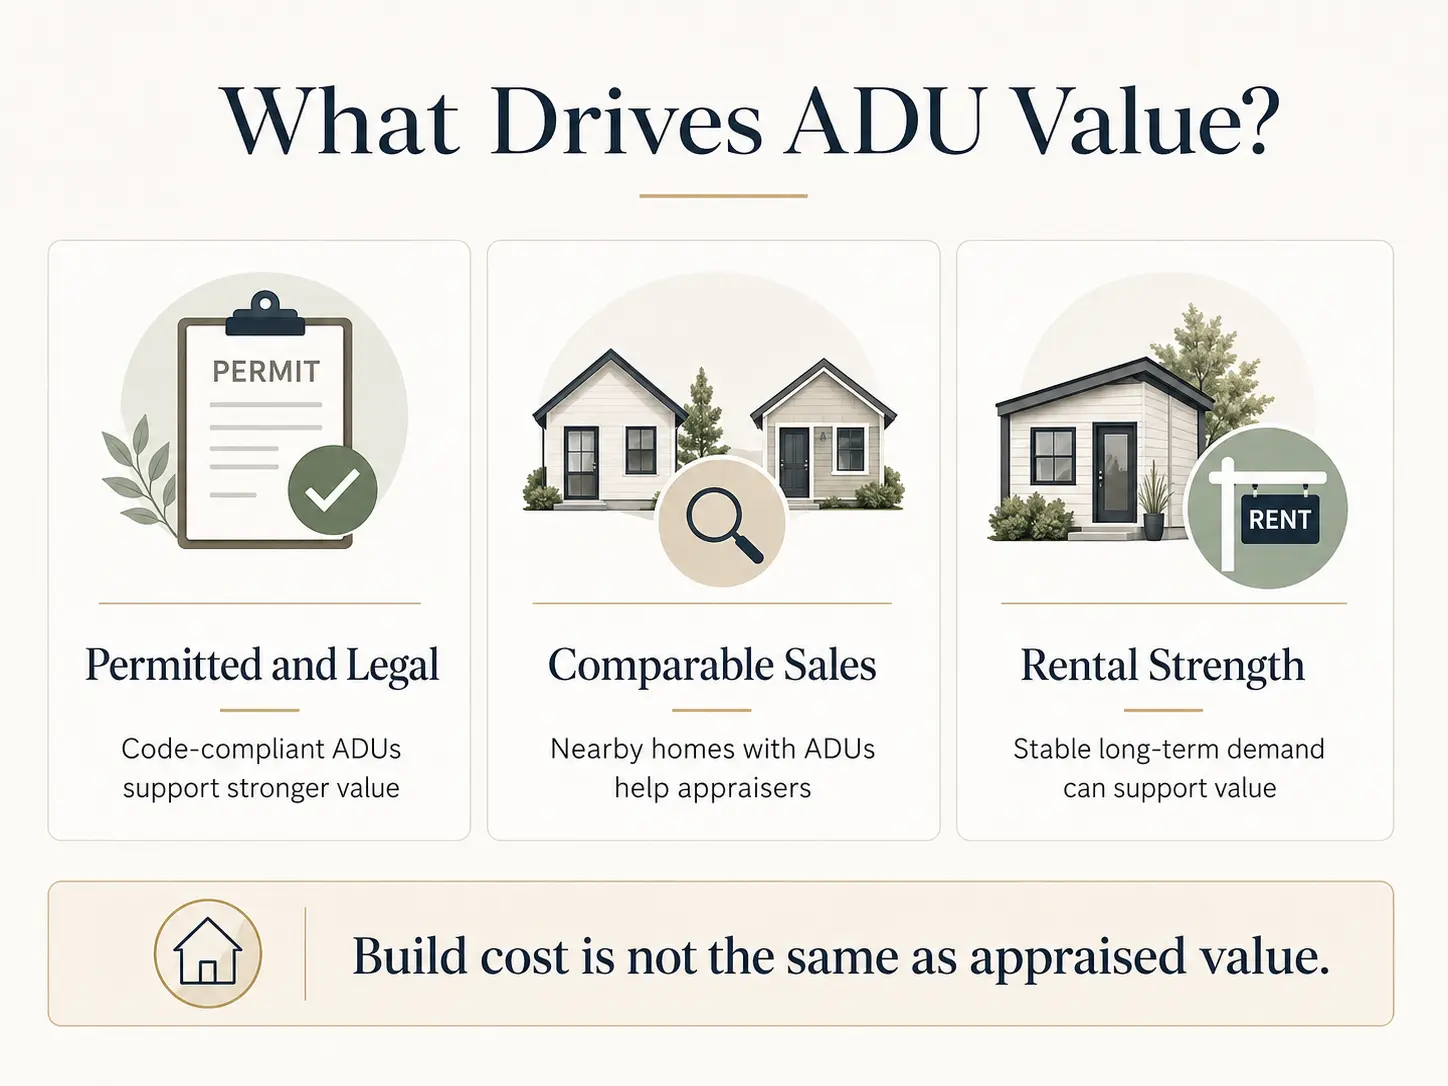
Build cost is a sunk number. Appraisal is a market opinion. Equity gain is what the market opinion will support against your loan balance. Those three things are not the same.
The three value lenses appraisers actually use
| Lens | The question it asks | When it’s used | Main risk |
|---|---|---|---|
| Sales comparison | Do similar homes with legal ADUs sell for more in this market? | Default lens; dominates appraisal | Fails when ADU comps don’t exist |
| Cost approach | What did the ADU cost to replicate? | Backup lens, especially for unique properties | Cost ≠ market value; depreciates |
| Income approach | What net operating income does the ADU generate at a market cap rate? | Used when rental is core to value (rare for SFR + ADU) | Most appraisers undervalue this lens for single-family parcels |
For a worked example, an 800 sq ft detached ADU in Los Angeles renting for $2,500/month generates ~$30,000 in annual gross income. After ~$6,000 in expenses, net operating income is ~$24,000. Applied at a 10% cap rate, the income-approach contributory value is roughly $240,000 — close to typical L.A. build cost for that footprint.
The honest part: when the comps don’t exist yet
The 25%-to-35% numbers you see on most ADU calculators assume your local market has ADU comparable sales mature enough for an appraiser to use the sales-comparison approach. In most of the United States outside California and a handful of Pacific Northwest metros, that’s not yet true. When comps don’t exist, appraisers commonly default to a contributory value of $25,000 to $50,000 — well below construction cost. This does not mean you didn’t build value. It means the value isn’t yet realized on the first appraisal report, and your refinance proceeds will reflect the lower figure until comp sales mature in your area. If you’re hoping to refinance ADU equity out within 12 months of completion, plan for the conservative number, not the optimistic one.
If you’re not sure where your ZIP code falls on that spectrum, the feasibility check tells you whether your address sits in a mature-comp market or an emerging one. Check your address → Get Your Free ADU Report.
What 2026 rent baseline should I use for an ADU?
Answer capsule. Start with HUD FY2026 Fair Market Rent (FMR) as a conservative rent baseline, then cross-check it against current long-term rental listings, property-manager estimates, and local vacancy. HUD FMRs are the 40th-percentile gross rent the federal government uses to set Housing Choice Voucher payment standards — a public, defensible baseline, not a market quote and not a guarantee.
2026 ADU Equity Reality Check: rent baseline vs. $250K gross payback
We assembled this table from the HUD FY2026 FMR dataset to show what a conservative public-source rent baseline looks like in the metros where most ADU construction happens. The “gross years to recover $250K” column is deliberately crude — it divides $250,000 by annualized 1-bedroom FMR before any vacancy, repairs, taxes, insurance, utilities, management, or financing cost.
| Metro | FY2026 1BR FMR | FY2026 2BR FMR | Annualized 1BR rent baseline | Gross yrs to recover $250K | Source |
|---|---|---|---|---|---|
| San Jose–Sunnyvale–Santa Clara, CA | $2,982 | $3,483 | $35,784 | 7.0 | HUD FY2026 FMR (standard) |
| San Diego–Chula Vista–Carlsbad, CA | $2,459 | $3,001 | $29,508 | 8.5 | HUD FY2026 FMR (standard) |
| Oakland–Fremont, CA | $2,385 | $2,912 | $28,620 | 8.7 | HUD FY2026 FMR (standard) |
| Los Angeles–Long Beach–Glendale, CA | $2,328 | $2,903 | $27,936 | 8.9 | HUD revised FY2026 FMR, published April 21, 2026; effective May 21, 2026 |
| Seattle–Bellevue, WA | $2,146 | $2,501 | $25,752 | 9.7 | HUD FY2026 FMR (standard) |
| Miami–Miami Beach–Kendall, FL | $1,995 | $2,436 | $23,940 | 10.4 | HUD FY2026 FMR (standard) |
| Denver–Aurora–Centennial, CO | $1,754 | $2,089 | $21,048 | 11.9 | HUD FY2026 FMR (standard) |
| Portland–Vancouver–Hillsboro, OR/WA | $1,677 | $1,922 | $20,124 | 12.4 | HUD FY2026 FMR (standard) |
| Phoenix–Mesa–Chandler, AZ | $1,583 | $1,839 | $18,996 | 13.2 | HUD FY2026 FMR (standard) |
| Austin–Round Rock–San Marcos, TX | $1,562 | $1,852 | $18,744 | 13.3 | HUD FY2026 FMR (standard) |
Source: U.S. Department of Housing and Urban Development, FY2026 Fair Market Rents dataset (huduser.gov/portal/datasets/fmr.html). The Los Angeles row reflects HUD’s revised FY2026 FMR published April 21, 2026 and effective May 21, 2026 (Federal Register notice 2026-07741). HUD FMRs are 40th-percentile gross rent estimates. These are illustrative examples, not guarantees of returns.
Why gross payback is not the same as ROI
Gross payback ignores vacancy, management, utilities, repairs, taxes, insurance, and financing cost. A $2,300 1-bedroom in Los Angeles produces $27,600 gross per year. After realistic operating costs and vacancy reserve, net operating income is closer to $18,000–$21,000. At $250,000 build cost financed through a HELOC, the first few years of payments absorb most of that net cash flow before the loan principal is meaningfully paid down.
When to override the HUD baseline
Use your own market rent figure instead of HUD FMR if any of these apply:
- The ADU will be furnished or short-term-rented (subject to local STR rules and, in California, the JADU short-term-rental prohibition under SB 543).
- The ADU is in a high-demand micro-neighborhood — near a university, major employer, or transit hub.
- The unit is unusually small (under 400 sq ft) or unusually large (over 900 sq ft), where HUD’s bedroom buckets fit poorly.
- Local rent control or rent stabilization caps your effective rent below market.
- Utilities are bundled into rent.
- The ADU will be used by family or for owner use — in which case the financial model becomes a housing-cost-avoidance calculation, not a yield calculation.
How will an appraiser actually value my ADU?
Answer capsule. Appraisers use one of two methods — comparable sales or income approach — and the result depends on whether legal ADU comps exist in your market. Fannie Mae requires the appraiser to analyze the ADU’s contribution to value and marketability separately from the primary dwelling when it’s a separate structure (Selling Guide B4-1.3-05, accessed May 20, 2026). Unpermitted ADUs commonly receive little or no lender-recognized value unless the lender, appraiser, insurance, and local-market evidence support eligibility.
Comparable sales (the dominant method)
The appraiser finds recent sales of homes in your market that also have legal ADUs. They adjust for differences in lot size, ADU size, ADU condition, and primary-house features, and arrive at a contributory value for the ADU. This works in San Diego, San Jose, Los Angeles, Oakland, and Portland — where the comp pool is deep — and works poorly almost everywhere else. JVM Lending’s underwriting-side commentary, updated June 14, 2024, captures the reality: when comparables aren’t there, appraisers default to $25,000–$50,000 contributory value, and underwriters reject anything above that without supporting comps.
Income approach (the rarely-used method)
The appraiser estimates the ADU’s net operating income and divides by a market capitalization rate. For an 800 sq ft detached ADU in a $2,500/month rental market, the math typically produces a contributory value of $200,000–$280,000. Most appraisers won’t use this lens for a single-family parcel because it isn’t the lens lenders ask for. Fannie Mae’s October 2025 rental-income rule change may push more lenders to request supporting income-approach analysis, especially in markets where ADU rentals are widely accepted — appraisers must take care to avoid double-counting ADU value through both income capitalization and comparable-sales adjustments.
The permitted-vs-unpermitted gap
This is the single biggest swing factor. Unpermitted or zoning-nonconforming ADUs:
- Commonly receive little or no lender-recognized appraisal value.
- Limit your future buyer pool — many financed offers will require the unpermitted unit to be either permitted or removed before closing.
- Can void homeowners-insurance coverage on losses related to the unpermitted structure.
- Frequently fail to support refinance proceeds.
Fannie Mae allows some zoning-nonconforming ADUs to remain eligible when insurance and appraisal requirements are met (Selling Guide B2-3-04, accessed May 20, 2026), but that’s a high bar most properties don’t clear without lender pre-engagement. If you have an existing unpermitted unit, permit-legalization is often the highest-ROI move you can make on the property.
What changed in October 2025: Fannie Mae now lets ADU rent count for qualifying
On October 8, 2025, Fannie Mae published Selling Guide Announcement SEL-2025-08, which for the first time allows rental income from an existing ADU on a one-unit principal residence to be counted toward a borrower’s qualifying income on a purchase or limited cash-out refinance. The rules in plain English:
- The property must be a one-unit principal residence.
- The transaction must be a purchase or limited cash-out refinance.
- Rental income can come from only one ADU, even if multiple ADUs exist.
- ADU rental income used for qualifying is capped at 30% of total qualifying income.
- Lenders typically use 75% of market or lease rent to account for vacancy and expenses.
- Desktop Underwriter version 12.1 was released the weekend of March 21, 2026 and now applies the rule to eligible loan casefiles automatically.
Sources: Fannie Mae Selling Guide Announcement SEL-2025-08, published October 8, 2025; DU Version 12.1 Release Notes, February 18, 2026; Selling Guide section B3-3.1-08, accessed May 20, 2026.
How does my financing path change net ADU equity?
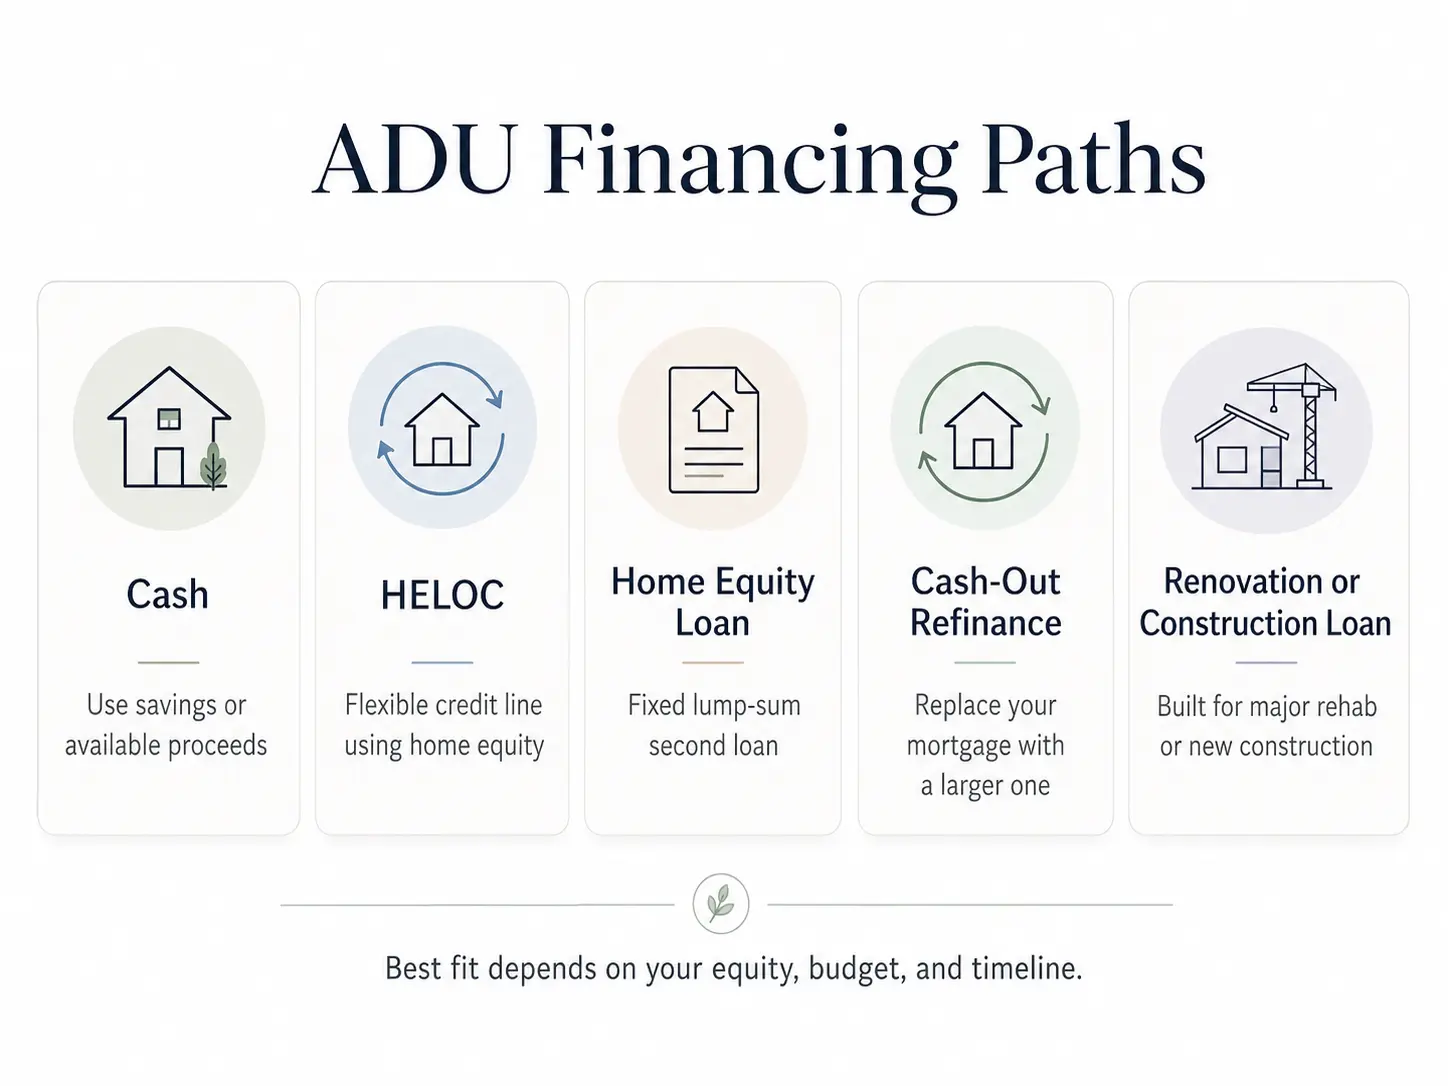
Answer capsule. The four common ADU financing paths produce dramatically different outcomes over the first 10 years. HELOCs preserve the most equity when you carry a low balance; cash-out refinances destroy the most equity in Year 1 to closing costs but recover it over time; construction-to-permanent loans are the only path that lends against after-completion value; all-cash builds maximize home equity from day one but leave project net position negative until appraisal plus net rent exceed the cash you spent.
Financing path × outcome comparison (2026 rate inputs)
| Path | Source-date national average | Closing costs typical | Year-1 home-equity impact | Year-1 project net position | Best fit |
|---|---|---|---|---|---|
| HELOC (variable) | 7.26% — Bankrate national avg, May 6, 2026 | $0–$500 | Smallest drag — interest-only draw possible | Negative until appraisal + net rent exceed loan + costs | Homeowners with ≥30% equity, comfortable with rate variability |
| Home equity loan (fixed) | 8.03% — Bankrate national avg, May 6, 2026 | $500–$1,500 | Moderate drag | Negative early | Rate-stability preference, defined budget |
| Cash-out refinance | ~1 point over conforming first-lien | 1.5%–3% of new loan | Largest Year-1 drag (closing costs) | Negative early; recovers over time | When you needed to refinance the first mortgage anyway |
| Construction-to-permanent | Variable during construction, then conforming | $3,000–$8,000 | Comparable to HELOC at completion | Negative early | Low current equity; lender lends against after-completion value |
| All cash | N/A | None | Largest positive change in home equity at completion | Negative unless appraisal exceeds cash cost | Available liquid capital; long horizon |
Rates above are source-date national averages, not guarantees of the rate you will be offered. Bankrate’s national survey aggregates rates across the largest U.S. lenders. Your actual rate depends on credit, equity, lender, and product.
Worked example: $700K home, $300K detached ADU, four financing paths
Same project — $700,000 pre-build value, $300,000 build cost, $200,000 base-case appraisal contribution, $2,200/month long-term rent — through each path at the source-date rates above.
| Path | Yr-1 home equity change | Yr-1 project net pos. | Yr-5 project net pos. | Approx. break-even |
|---|---|---|---|---|
| HELOC @ 7.26% | +$192,000 | −$8,000 | +$74,000 | Year 3–4 |
| Home equity loan @ 8.03% | +$188,000 | −$12,000 | +$66,000 | Year 4 |
| Cash-out refinance | +$176,000 | −$24,000 | +$60,000 | Year 4–5 |
| Construction-to-perm | +$189,000 | −$11,000 | +$70,000 | Year 4 |
| All cash | +$200,000 | −$100,000 | −$25,000 (with net rent) | Year 8–10 |
Illustrative scenarios. Not guarantees of appraised value, loan approval, rental income, or returns.
The takeaway: across financed paths, Year-1 project net position is negative for most homeowners. By Year 4 to 5 with rent, the math turns. For all-cash builds, home equity rises substantially on Day 1, but project net position stays negative until appraisal plus cumulative net rent exceed what you spent in cash.
Compare current mortgage and construction loan options through our partner Mortgage Research Center:
Compare loan options →Affiliate link — verify availability in your state.
For the deep dive on each financing path, including Fannie Mae’s selling-guide treatment of each, see How to Finance an ADU in 2026: 7 Paths Compared.
What formula does the ADU equity calculator use?
Answer capsule. The calculator runs a five-line model with two outputs — home equity change and project net position. Every input is sourced and every assumption is disclosed.
Line 1: After-completion appraised value.
Pre-build value × your regional editorial scenario band, adjusted for ADU type (detached gets the upper end of the band; garage conversion gets the lower end; unpermitted gets zero or near-zero) and size. When your market lacks ADU comps, the conservative scenario applies the JVM Lending appraiser-default range of $25,000–$50,000 as a floor.
Line 2: Loan principal balance.
Standard amortization at the source-date national-average rate the user selects. We don’t quote your specific rate — that’s a lender’s job.
Line 3: Closing costs.
- HELOC: $0–$500 typical
- Home equity loan: $500–$1,500
- Cash-out refinance: 1.5%–3% of new loan amount
- Construction-to-permanent: $3,000–$8,000
Line 4: Cumulative property-tax delta.
California (Proposition 13): only the ADU portion is reassessed — typically about 1% of ADU appraised value per year. Outside California, reassessment rules vary by state, county, and assessment system; treat property tax as a county-assessor verification item.
Line 5: Cumulative net rental income.
Optional. If you toggle “rented,” we apply: monthly rent × 12 × 0.95 occupancy × 0.70 net-to-owner factor, which assumes a combined 30% expense, vacancy, and maintenance reserve. Lender-counted rent is different from owner-cash-flow rent — see the Fannie Mae section above.
A note on Proposition 13 and California ADUs
For California homeowners specifically: under Proposition 13, building an ADU does not trigger a full property reassessment. The county assessor performs a “blended assessment,” reassessing only the new improvement value (the ADU) at current market rates while the pre-existing structure continues to enjoy its Prop 13 base year. A $200,000 ADU appraisal contribution typically increases annual property tax by roughly $2,000 in most California counties. Source: California State Board of Equalization Proposition 13 framework; San Mateo County Assessor ADU/JADU assessment guidance, accessed May 20, 2026.
Equity payback: how long until your ADU is net-positive?
Answer capsule. Most ADU projects show negative project net position in Year 1 once closing costs and the first appraisal cycle are loaded. With rental income, project break-even commonly arrives between Year 3 and Year 8 depending on rent, financing path, and how much of the appraisal premium your market supports. Without rental income — when the ADU houses family or is for owner use — break-even can extend to Year 10 to Year 15, but the operational return (housing a parent, adult child, or yourself) often dominates the financial return.
Three worked scenarios
| Scenario | Pre-build value | Build cost | Financing | Rented? | Yr-1 project net pos. | Approx. break-even |
|---|---|---|---|---|---|---|
| California / 800 sq ft detached | $850,000 | $400,000 | HELOC @ 7.26% | Yes, $3,000/mo | ~$10,000 | Year 3–4 |
| Pacific NW / 500 sq ft garage conversion | $600,000 | $150,000 | Home equity loan @ 8.03% | Yes, $1,800/mo | ~$5,000 | Year 4–5 |
| Southeast / 700 sq ft detached | $400,000 | $250,000 | Cash-out refi | No | ~−$40,000 | Year 9–12 |
Illustrative scenarios. Not guarantees of appraised value, loan terms, or rental income.
What if I don’t have enough equity?
Answer capsule. A current-equity shortfall doesn’t kill the project. It means a HELOC or home equity loan can’t cover the full build, and the next step is to compare paths that lend against after-completion value, smaller-footprint alternatives, or future-value financing.
Three reasons the equity gap shows up
| Reason | What it means | First move |
|---|---|---|
| Low current tappable equity | Home value × CLTV − mortgage balance leaves too little headroom | Test construction-to-perm or renovation loan paths |
| Budget is too high for the value created | Cost is racing ahead of appraisal support | Redesign smaller, switch to garage conversion or prefab |
| Lender or appraiser won’t credit future value or full rent | Spreadsheet works; underwriting doesn’t | Get an early lender conversation before paying for plans |
Financing paths when you’re short on current equity
| Path | When it fits | Main caution |
|---|---|---|
| Renovation or construction-to-permanent loan | You need future value considered | More documentation; appraisal-as-completed required |
| Cash-out refinance | Existing first-mortgage rate still works | Replaces a favorable first mortgage |
| Renovation HELOC | You want to borrow against after-renovation value | State availability varies by lender; verify before applying |
| Home equity investment (Hometap, Unlock, Point) | No monthly payment; share future appreciation | Limited state availability; settlement window forces eventual buyout |
| Local grants or incentives | A funded local program exists | Programs pause, waitlist, or cap eligibility — verify current status with your city |
| Future-value financing | Project value will likely support the loan | Lender and appraisal rules must be verified early |
Before you start loan-shopping, verify what you can actually build at your address. Most homeowners who think they have an equity problem actually have an ADU-size or ADU-type problem — and the cheaper redesign solves it without changing the loan.
Then compare paths:
Compare current mortgage and construction loan options →Affiliate link — verify availability in your state.
For the full lane-by-lane breakdown including qualification rules, see How to Finance an ADU in 2026: 7 Paths Compared and HELOC for ADU 2026: Rates, Equity Math.
Can ADU rent help me qualify for a mortgage?
Answer capsule. Yes — and the rules just changed. Fannie Mae Selling Guide Announcement SEL-2025-08, effective October 8, 2025, allows rental income from an existing ADU on a one-unit principal residence to count toward qualifying income on a purchase or limited cash-out refinance, capped at 30% of the borrower’s total qualifying income, with rent typically haircut to 75% to account for vacancy and expenses. Desktop Underwriter version 12.1 was released the weekend of March 21, 2026 and applies the rule automatically to eligible loan casefiles.
Calculator rent vs. lender-counted rent
These are different numbers. Don’t conflate them.
| Rent use | Calculator estimates | Lender will allow |
|---|---|---|
| Gross rent-payback period | Yes — useful planning tool | Not equivalent to qualifying income |
| Net operating income | Yes — closer to true cash flow | Depends on lender underwriting and documentation |
| Qualifying income on a Fannie loan | Yes, as a scenario only | Capped at 30% of total qualifying income; 75% rent haircut typical |
| Appraisal value support | Sometimes | Depends on appraiser, market comps, and avoidance of double-counting |
Documentation Fannie Mae expects
To count ADU rent for qualifying, lenders typically require:
- A signed lease (if the unit is already rented), or
- Form 1007 — Single-Family Comparable Rent Schedule, attached to the appraisal, showing market rent for the ADU.
- Standard rental-income documentation in Selling Guide section B3-3.1-08.
Source: Fannie Mae Selling Guide B3-3.1-08 (accessed May 20, 2026); Selling Guide Announcement SEL-2025-08 (published October 8, 2025); DU Version 12.1 Release Notes (February 18, 2026).
How much do property taxes and insurance drag down ADU equity?
Answer capsule. Property tax and insurance changes after an ADU build are real but usually a small fraction of the rental income the ADU produces. In California under Proposition 13, only the ADU portion is reassessed — typically a 1% annual increase on the ADU’s appraised value. Outside California, reassessment rules vary by state, county, and assessment system. Landlord insurance, if you rent the unit, runs $400–$1,200 per year above standard homeowners coverage.
California (Proposition 13)
The California State Board of Equalization framework under Prop 13 limits annual property-tax increases on the pre-existing structure to the lesser of 2% or the rate of inflation, regardless of market value changes. A new ADU is “new construction” and is reassessed at its current market value at the time of completion — but only the ADU itself, not the existing home. Practical impact: a $200,000 ADU appraisal contribution adds roughly $2,000/year in property tax in most California counties.
Outside California
Reassessment rules vary by state, county, and assessment system. Some states reassess only new construction; others reassess the entire property periodically. Treat this as a verification item with your county assessor before you commit budget. Annual property-tax delta from an ADU is rarely a project-killer in isolation, but it adds up over a 10-year hold.
Landlord insurance
If you rent the ADU, you’ll need a landlord policy or a rider on your existing homeowners policy. Premium uplift typically runs $400–$1,200/year depending on unit size, market, and coverage limits. Build it into your net-rent calculation.
Property tax treatment varies by state, county, and locality. Consult your county assessor and a tax advisor before making financial decisions.
How much should the ADU itself cost?
Answer capsule. Published 2026 cost guides put most ADUs around $40,000 to $360,000 total and roughly $150 to $300 per square foot on average, with detached new builds often around $200,000–$400,000. Garage conversions average around $110,000 in Angi’s 2026 data. Local quotes vary widely from national benchmarks and should drive your calculator input.
National cost benchmarks (use as directional only)
| ADU type | Typical cost range | Per sq ft range | Equity-risk notes |
|---|---|---|---|
| Garage conversion | $80,000–$160,000 (Angi avg ~$110,000) | $150–$300 | Existing slab, ceiling height, fire separation, and parking-replacement requirements can add cost |
| Basement conversion | $50,000–$150,000 | $100–$250 | Egress, moisture, ceiling height, and access can be expensive |
| JADU (California, ≤500 sq ft, carved from existing home) | $50,000–$120,000 | $100–$250 | Lowest cost path; limited rent potential |
| Attached ADU (new addition) | $200,000–$350,000 | $250–$400 | May affect main-house layout and utility routing |
| Detached ADU (new build) | $200,000–$400,000+ in coastal CA | $200–$400 | Highest site, utility, foundation, soft-cost exposure |
| Prefab/modular detached | $150,000–$400,000+ | Factory price + site work | Factory price ≠ installed cost; verify site work scope |
Sources: Angi 2026 ADU cost data (angi.com); SelfStorage.com 2026 ADU construction cost guide. Mark local market defaults as planning ranges to verify with local bids — not as verified national appraisal data.
For the full cost breakdown by ADU type, size, and state, see our ADU Cost Per Square Foot guide and How Much Does an ADU Cost?
The hidden costs most calculators ignore
These are planning ranges to verify with your local builder bids — not verified national cost data:
- Sewer lateral upgrade or replacement — $5,000–$25,000 depending on length and depth
- Electrical service panel upgrade — $3,000–$8,000 to go from 100A to 200A service
- Fire sprinklers — In California, an ADU cannot be required to provide fire sprinklers if the primary residence does not require them, and ADU construction cannot trigger a sprinkler requirement for the existing primary dwelling (California Government Code §66314 and §66338; HCD ADU Handbook, 2026 update). Outside California or where the primary residence is already sprinklered, sprinklers may add $5,000–$15,000.
- Trenching for water, gas, electrical, and sewer — $50–$150 per linear foot
- Foundation surprises on conversions — $5,000–$30,000 when existing slab fails inspection
- Tree removal, drainage, grading — $2,000–$20,000
- Impact fees — California law restricts these: ADUs under 750 sq ft are exempt from impact fees, and fees for larger ADUs must be proportional to the burden the ADU places on services (California Government Code §66324). Other states and localities vary widely.
What can make an ADU equity estimate wrong?
Answer capsule. The biggest sources of error are unpermitted construction, missing utility upgrades, underestimated soft costs, overestimated rent, double-counting rent across value/cash-flow/qualifying income, and assuming a detached ADU will be valued like ordinary primary-house square footage.
The eight errors we see most often
- Treating ADU square footage as primary-house square footage. Detached ADUs and most attached units are reported separately on the appraisal. Don’t multiply your $/sqft against ADU sqft.
- Using national-percentage premiums in markets without comps. The number only holds where the comp pool supports it.
- Building without permits. Little or no appraisal value, smaller buyer pool, possible insurance gaps.
- Skipping utility-upgrade budget. Sewer lateral and panel upgrades are the most common budget-busters.
- Quoting gross rent, not net. Vacancy, management, insurance, taxes, utilities, maintenance — model the haircut.
- Double-counting rent. Don’t use the same rent for appraisal support, owner cash flow, and Fannie qualifying income simultaneously.
- Ignoring property tax delta. Small line, real number.
- Modeling Year-1 instead of Year-5. Year 1 is almost always negative project net position. Use the calculator’s 5-year and 10-year output to make the decision.
Zoning and permitting
The calculator’s equity output is only as valid as the legal assumption behind it. Examples of state-level legal frameworks worth knowing:
- California ADU law is codified in Government Code §§66310–66342 (consolidated by SB 477, effective March 2024; further updated by SB 543 and other 2025 legislation). A complete ADU/JADU application for a lot with an existing dwelling must be processed ministerially within 60 days. HCD has enforcement authority under §66313.5 and can void noncompliant local ordinances. Source: California Government Code §§66310–66342; California HCD ADU Handbook, 2026 update.
- Oregon SB 1051 (2017) — requires cities over 2,500 population and counties over 15,000 population to allow at least one ADU for each detached single-family dwelling in areas zoned for detached single-family dwellings.
- Washington HB 1337 (2023), codified in RCW 36.70A.680, .681, and .696 — requires fully planning cities and counties to allow two ADUs on residential lots that permit single-family homes within an urban growth area, with stated limitations.
Verify your specific state and city rules before committing budget. We track major state laws on our Regulations & Permits hub.
Move forward, pause, or stop
Answer capsule. A green calculator result means the math works on conservative assumptions and the next step is a property feasibility check. Yellow means one major assumption is unverified. Red means the project needs redesign or a financing-path pivot before you spend on plans.
Decision framework
| Result | What it means | Next action |
|---|---|---|
| Move forward (Green) | Conservative rent, cost, and value assumptions all work. | Get a property-specific feasibility report. Lock a real construction quote. |
| Pause and verify (Yellow) | Project works only if one key assumption holds. | Verify zoning, rent, appraisal expectation, or lender treatment before spending. |
| Redesign (Yellow–Red) | Cost is too high for value created. | Test garage conversion, smaller detached, prefab, or attached configuration. |
| Check financing (Yellow–Red) | Feasible but current equity is short. | Compare construction-to-perm or renovation-loan paths before applying for a HELOC. |
| Stop for now (Red) | Zoning, utility, or financing constraint breaks the model. | Resolve the constraint before paying for plans. |
The calculator’s job is to send you to one of these five rows. The next page’s job — feasibility check — is to verify the constraint that determines your row.
See What You Can Build → Get Your Free ADU ReportThree worked examples
We ran the calculator against three realistic scenarios so you can see the formula in action.
Example 1: San Diego, detached 800 sq ft ADU on a $900K home
- Pre-build home value: $900,000
- Current mortgage balance: $500,000
- ADU build cost: $400,000 (San Diego coastal market)
- Rent input: $2,500/month (HUD San Diego FY2026 1BR FMR baseline at $2,459/mo)
- Regional band: 22–35% scenario range (FHFA-anchored California)
Current-equity borrowing room at 80% CLTV: $900K × 0.80 − $500K = $220,000. HELOC alone does not fund the full build.
Conservative appraisal scenario: $900K × 22% = $198,000 added value.
Optimistic scenario: $900K × 35% = $315,000 added value.
Annual net rent (after 30% reserve): ~$24,400.
Year-5 project net position: ~$80,000 (base) to ~$160,000 (optimistic).
Result: Yellow — feasible if borrower can solve the financing gap. Recommend exploring construction-to-perm.
Example 2: Austin, garage conversion ADU on a $550K home
- Pre-build home value: $550,000
- Current mortgage balance: $300,000
- ADU build cost: $130,000 (garage conversion, mid-market)
- Financing: Home equity loan @ 8.03% (Bankrate national average, May 6, 2026)
- Rent input: $1,562/month (HUD Austin FY2026 1BR FMR baseline)
- Regional band: 10–25% scenario range — NEEDS VERIFICATION for Texas markets
Tappable equity (80% CLTV): $550K × 0.80 − $300K = $140,000 → loan fits within current equity.
Conservative appraisal scenario: appraiser default $30,000.
Base scenario (10% premium): $55,000 added value.
Year-5 project net position: ~$30,000 to ~$70,000.
Result: Yellow — cost discipline matters more than headline rent. If the conservative appraisal scenario plays out, payback runs 7–10 years.
Example 3: Portland, prefab 600 sq ft detached on a $650K home, low current equity
- Pre-build home value: $650,000
- Current mortgage balance: $520,000
- ADU build cost: $280,000 all-in (prefab unit + site work)
- Financing: Construction-to-permanent (lends against after-completion value)
- Rent input: $1,677/month (HUD Portland FY2026 1BR FMR baseline)
- Regional band: 15–30% scenario range (PNW emerging-mature)
Current tappable equity (80% CLTV): $650K × 0.80 − $520K = $0 → no current-equity path works.
Base appraisal scenario: $130,000 added value.
After-completion value (base case): $780,000 → CLTV on $800K total debt = 102% → exceeds typical lender limits.
Result: Red — current path doesn’t pencil. Recommend redesign to a $180K garage conversion or wait until home value appreciation creates more equity headroom.
Worked examples are illustrative, not guarantees of appraised value, loan approval, rent, or returns. Actual results depend on local market conditions, construction costs, financing terms, and regulatory approvals.
What we verified
Last verified: May 20, 2026
For this calculator and page, The Dwelling Index editorial team verified:
- HUD FY2026 Fair Market Rent methodology and metro-level data — huduser.gov/portal/datasets/fmr.html.
- HUD revised FY2026 FMR for Los Angeles — Federal Register notice 2026-07741, published April 21, 2026, effective May 21, 2026.
- Fannie Mae Selling Guide ADU appraisal-treatment rules — Selling Guide B4-1.3-05 and B2-3-04, accessed May 20, 2026.
- Fannie Mae Selling Guide Announcement SEL-2025-08 — October 8, 2025 rule allowing existing ADU rental income for qualifying income, with the 30% cap.
- Fannie Mae DU Version 12.1 Release Notes — released the weekend of March 21, 2026; applies the SEL-2025-08 ADU rental-income rules automatically.
- FHFA Uniform Appraisal Dataset blog — accessed May 20, 2026.
- Bankrate national HELOC and home equity loan rate survey — source-date averages as of May 6, 2026.
- JVM Lending appraisal commentary — updated June 14, 2024.
- UC Berkeley Terner Center “ADU Equity” — August 2022.
- California Government Code §§66310–66342 consolidated ADU law (2025 session).
- California HCD ADU Handbook 2026 update.
- California Government Code §66314 / §66338 — fire-sprinkler rule for ADUs and JADUs.
- California Government Code §66324 — impact-fee exemption for ADUs under 750 sq ft.
- California State Board of Equalization Proposition 13 ADU treatment framework.
- Oregon SB 1051 — ADU requirement for cities and counties.
- Washington RCW 36.70A.680, .681, .696 — HB 1337 two-ADU requirement.
The Dwelling Index is an independent research resource covering ADU financing, costs, and regulations. We are not a lender, broker, builder, or appraiser.
Methodology
Answer capsule. This calculator separates three layers of inputs — verified public data, user-entered property information, and editorial routing — and is transparent about which is which. It does not promise loan approval, appraised value, rental income, or investment return.
| Layer | What it includes | How we treat it |
|---|---|---|
| Verified public data | HUD FMRs; Fannie/FHA/Freddie guidance; FHFA appraisal data; California Board of Equalization tax framework; source-date Bankrate national rates | Cite and date-stamp; re-verified monthly or on agency update |
| Published industry benchmarks | National ADU cost ranges; appraiser commentary on default contributory values | Treat as directional; mark local defaults for verification |
| Editorial scenario logic | Non-California regional appraisal-premium bands; hidden-cost planning ranges | Frame as editorial scenarios with NEEDS VERIFICATION labels where appropriate |
| User-entered data | Home value, mortgage balance, build cost, rent, financing path | Treat as assumptions; allow override on every default |
| Editorial routing | Move-forward / pause / redesign / check-financing labels | Frame as editorial guidance, not financial advice |
What this calculator does not do
- It does not replace a lender. Get actual loan quotes.
- It does not replace an appraiser. Talk to one for a high-cost or unusual project.
- It does not verify zoning by itself. Verify with your city’s planning department or run a feasibility check.
- It does not guarantee rental income. HUD FMR is a public baseline, not a market quote.
- It does not quote rates, APRs, payments, or approval odds.
Frequently asked questions
- Is there a single formula for how much value an ADU adds?
- No universal formula applies nationwide. A defensible model uses conservative, base, and optimistic scenarios anchored to your region's ADU comp maturity, then verifies the scenario against legal status, permitting, comparable sales evidence, and lender treatment. FHFA 2023 California data anchors the upper-end California scenario.
- Does ADU equity mean property value, home equity, or net worth?
- All three are real, but they're different numbers. Added property value is what an appraiser writes on the next report. Home equity is after-completion appraised value minus all home-secured debt. Project net position is whether appraisal contribution plus cumulative net rent has exceeded what you spent in cash and closing costs. The calculator shows both home equity and project net position because financed and all-cash builds behave very differently.
- Does an ADU count as square footage?
- Not as primary-residence square footage in most cases. Fannie Mae's Selling Guide requires the appraiser to report most ADUs separately from the primary dwelling's finished living area unless the ADU is contained within or part of the primary home with interior access. The appraiser analyzes its contribution to value on its own.
- Is a garage conversion better for equity than a detached ADU?
- Sometimes. A garage conversion typically costs $80,000–$160,000 vs. $200,000–$400,000+ for a new detached build, which improves payback. But conversions can hide cost — code-required ceiling height, fire separation, replacement parking, and existing slab issues are common surprises. Detached ADUs often appraise higher because they're truly independent units.
- Can I use a HELOC to build an ADU?
- Yes, if you have enough tappable equity to fund the full project under your lender's CLTV cap (typically 80%–85%). If the calculator shows a current-equity shortfall, compare construction-to-permanent or renovation-loan paths rather than assuming a HELOC will stretch to cover the full build. National-average HELOC rate is 7.26% per Bankrate's May 6, 2026 survey.
- Can ADU rental income help me qualify for a mortgage?
- Yes — Fannie Mae Selling Guide Announcement SEL-2025-08, effective October 8, 2025, allows rental income from an existing ADU on a one-unit principal residence on purchase or limited cash-out refinance transactions, capped at 30% of total qualifying income, with rent typically haircut to 75% to account for vacancy and expenses. Documentation requires either a signed lease or Fannie Mae Form 1007 (Single-Family Comparable Rent Schedule). DU version 12.1, released March 21, 2026, applies the rule automatically to eligible loan casefiles.
- Does an ADU always increase property taxes?
- It depends on your state's reassessment framework. In California under Proposition 13, only the ADU portion is reassessed — typically adding about 1% of ADU appraised value annually in property tax. Outside California, treat reassessment as a county-assessor verification item rather than assuming a particular treatment.
- Does an unpermitted ADU add equity?
- Rarely. Unpermitted ADUs commonly receive little or no lender-recognized appraisal value, limit your future buyer pool, and can void insurance coverage on related losses. Fannie Mae allows some zoning-nonconforming ADUs to remain eligible when insurance and appraisal requirements are met, but the bar is high. Permit before assuming any equity benefit.
- Should I talk to an appraiser before building?
- For high-cost projects, unusual ADU types, weak comparable-sales markets, or financing that depends on after-completion value, yes — an early appraisal-or-lender conversation can prevent a bad assumption from driving the project. The cost of a pre-construction appraisal consultation ($500–$1,200) is small compared with $300K of design and build commitments.
- Why does the calculator show three different appraisal scenarios?
- Because the single biggest source of equity-estimate error is treating appraisal contribution as a fixed percentage of home value. In mature ADU markets (coastal California, Portland), upper-band figures hold. In emerging markets, mid-band figures hold. In early-comp markets, the $25K–$50K appraiser-default floor is a real risk. We show you all three so the decision survives reality.
- Does the calculator work in every state?
- Yes for rough financial modeling. But state and city zoning, permitting, tax treatment, rent rules, and financing availability vary materially. The calculator's output is a planning input — the next step, property feasibility, must be specific to your address.
Where to go next
We built this page so you walk away with one clear next step.
If you want to verify your property qualifies for the ADU you modeled:
See what’s possible at your address — get your free ADU report in 60 secondsIf you’re ready to compare financing options:
Compare current mortgage and construction loan options →Affiliate link — verify availability in your state.
If you want our complete planning toolkit:
Download the Free 2026 ADU Starter Kit →Includes the equity worksheet, financing comparison reference, and the regional appraisal-maturity scenario reference from this page in printable form.
Not sure where to start? See what’s possible at your address — get your free ADU report in 60 seconds.
Sources and citations
| Claim | Source | Verification date |
|---|---|---|
| FHFA California ADU appraisal data: median $1,064,000 with ADU vs. $715,000 without (2023); annualized growth 9.34% vs. 7.65% (2013–2023) | Federal Housing Finance Agency, "Trends in Median Appraised Value for Properties With Accessory Dwelling Units in California," fhfa.gov/blog | May 20, 2026 |
| Fannie Mae ADU appraisal treatment — analyzed separately from primary dwelling | Fannie Mae Selling Guide B4-1.3-05 | May 20, 2026 |
| Fannie Mae one-unit ADU eligibility — only one ADU permitted on the parcel | Fannie Mae Selling Guide B2-3-04 | May 20, 2026 |
| Fannie Mae ADU rental income — 30% cap on qualifying income, one-unit principal residence, purchase or limited cash-out refi | Fannie Mae Selling Guide Announcement SEL-2025-08 | Effective October 8, 2025; verified May 20, 2026 |
| DU Version 12.1 release applying ADU income rules | Fannie Mae DU Version 12.1 Release Notes, February 18, 2026 | Released March 21, 2026 |
| 75% rent haircut standard for vacancy and expense | Fannie Mae Selling Guide B3-3.1-08 | May 20, 2026 |
| National-average HELOC rate 7.26% | Bankrate national lender survey | May 6, 2026 |
| National-average home equity loan rate 8.03% | Bankrate national lender survey | May 6, 2026 |
| Appraiser-default contributory value $25,000–$50,000 when comps absent | JVM Lending blog, jvmlending.com | Updated June 14, 2024 |
| Porch.com 35% ADU listing-price premium (asking price, not appraisal) | Porch.com analysis, republished via NFM Lending and others | May 20, 2026 |
| Portland Equity Study — income-approach valuation 7.2–9.8% higher than sales price | Kol Peterson research, 14 Portland permitted ADUs | Original 2011; methodology still cited 2026 |
| UC Berkeley Terner Center ADU Equity report | ternercenter.berkeley.edu | August 2022 |
| HUD FY2026 Fair Market Rents | huduser.gov/portal/datasets/fmr.html | May 20, 2026 |
| HUD revised FY2026 FMR (Los Angeles) | Federal Register notice 2026-07741, published April 21, 2026; effective May 21, 2026 | May 20, 2026 |
| California ADU law codified at Gov. Code §§66310–66342 | California Government Code; California HCD ADU Handbook 2026 update | May 20, 2026 |
| California ADU fire-sprinkler rule | California Gov. Code §66314 (ADUs) and §66338 (JADUs); HCD ADU Handbook 2026 update | May 20, 2026 |
| California ADU impact-fee exemption under 750 sq ft | California Gov. Code §66324 | May 20, 2026 |
| California Proposition 13 blended-assessment framework | California State Board of Equalization; San Mateo County Assessor ADU guidance | May 20, 2026 |
| Oregon SB 1051 ADU requirement | Oregon Department of Land Conservation and Development | May 20, 2026 |
| Washington HB 1337 two-ADU requirement | RCW 36.70A.680, .681, .696; Washington State Department of Commerce | May 20, 2026 |
| ADU construction cost ranges | Angi 2026 ADU cost data; SelfStorage.com 2026 ADU construction cost guide | May 20, 2026 |
Disclosures
The Dwelling Index is an independent research resource covering ADU financing, costs, and regulations. We are not a lender, broker, builder, or appraiser.
The calculator and figures on this page produce illustrative estimates based on the methodology disclosed above. They are not guarantees of appraised value, loan approval, rental income, or investment return. Actual results depend on local market conditions, construction costs, lender requirements, your appraisal, and regulatory factors. Property tax treatment varies by state and locality. Consult a qualified appraiser, lender, and tax advisor before making financial decisions.