
ADU Property Values by Metro: Homes With an ADU Had Higher Median Appraisals in 43 of 45 Metros in 2023
By The Dwelling Index Editorial Team · Updated September 2026
Homes with an accessory dwelling unit (ADU) had higher median appraisals in 43 of 45 metros with at least 100 appraisals per group in 2023, The Dwelling Index's analysis of Federal Housing Finance Agency data found. Gaps ran from −3.8% in Nassau–Suffolk, N.Y., to +83.3% in Nashville. Our ADU property values by metro table covers 93 usable comparisons. But a gap isn't what an ADU adds.
Find your metro · Download the CSV · Copy a citation
Key ADU property value statistics
- Higher in 43 of 45: In 2023, homes with an ADU had a higher median appraisal than homes without one in 43 of the 45 metro areas and divisions with at least 100 purchase appraisals in each group. (The Dwelling Index analysis of FHFA Enterprise single-family appraisal data, September 2026)
- −3.8% to +83.3%: Across 45 metros with at least 100 purchase appraisals in each group, the 2023 gap ran from −3.8% in Nassau–Suffolk, N.Y. ($625,000 with an ADU vs. $650,000 without) to +83.3% in Nashville ($843,000 vs. $460,000). (The Dwelling Index analysis of FHFA data)
- 34.8%: The typical metro's median-appraisal gap in 2023 — the middle value of the 45 metro gaps with at least 100 purchase appraisals per group, giving each metro equal weight. (The Dwelling Index analysis of FHFA data)
- $645,000 vs. $390,000: The U.S. median appraisal in 2023 for homes with an ADU and for homes without one, a gap of $255,000, or 65.4%, in FHFA's Enterprise single-family purchase-appraisal data. (FHFA national data; gap calculated by The Dwelling Index)
- 41 of 45: The U.S. median-appraisal gap of 65.4% in 2023 was bigger than the gap inside 41 of the 45 metros with at least 100 purchase appraisals in each group. (The Dwelling Index analysis of FHFA metro and national data)
- About 1 in 80: Homes with an ADU made up 25,888 of 2,079,297 U.S. Enterprise single-family purchase appraisals with known ADU status in 2023, or 1.2%. (FHFA)
- 4.7%: The share of FHFA's national 2023 ADU purchase appraisals that came from the Los Angeles–Long Beach–Glendale division (1,206 of 25,888). For homes without an ADU, it was about 1 in 82 (25,170 of 2,053,409). (The Dwelling Index analysis of FHFA metro and national data)
- $1,063,000 vs. $715,000: California's statewide median purchase appraisals in 2023 for homes with and without an ADU, a 48.7% gap, in FHFA's v3.3 state file. (FHFA; gap calculated by The Dwelling Index; the agency's blog differs)
- +72.0% vs. +62.5%: How much the U.S. median purchase appraisal rose from 2013 to 2023 for homes with an ADU ($375,000 to $645,000) and without one ($240,000 to $390,000). These are annual group medians, not growth in the same homes. (The Dwelling Index analysis of FHFA data)
- 7% to 9% (estimated): The authors' preferred estimates for ADU-related assessed-value and sale-price differences in city of Los Angeles parcel data from 2013 to 2019. This is not a guaranteed gain or a confidence interval. (Brueckner and Thomaz, Real Estate Economics, 2024)
- 35% (reported in 2021): The often-repeated "ADUs add 35%" comes from Porch's comparison of August 2021 asking prices, not appraisals, sales, or the same homes before and after. The archive states the figure but does not fully explain its aggregation. (Porch Research, archived copy)
On this page: Every metro · Biggest gaps · Lower with an ADU · Where ADUs are common · California · U.S. vs. metro · Since 2013 · What an ADU adds · The 35% claim · Method · Cite · Download · FAQ
How much more do homes with an ADU appraise for, metro by metro?
In 2023, the typical gap was 34.8% across the 45 metros with at least 100 appraisals in each group. The gaps ranged from −3.8% in Nassau–Suffolk, N.Y., to +83.3% in Nashville. Each gap compares the median appraisal of homes with an ADU to homes without one in the same metro.
A few words first. An ADU is a second, smaller home on the same lot as a house — a backyard cottage, a garage apartment, a basement unit. It has its own kitchen, bathroom, and place to sleep. ADU definition An appraisal is an appraiser's opinion of what a home is worth, done here for a home-purchase loan. Appraisal definition The median is the middle value when the appraisals are put in order.
The numbers come from the Federal Housing Finance Agency (FHFA), which oversees Fannie Mae and Freddie Mac. Its appraisal files flag whether a home has an ADU. We pulled the 2023 figures for the 100 metro areas and divisions in its file and did the math. A division is part of a larger metro. Here, "metro" covers both. All FHFA comparisons on this page use Enterprise single-family purchase appraisals.
Here's one way to picture it. For each $1 in Nashville's no-ADU median, its with-ADU median was about $1.83. In Nassau and Suffolk counties on New York's Long Island, it was about 96 cents.
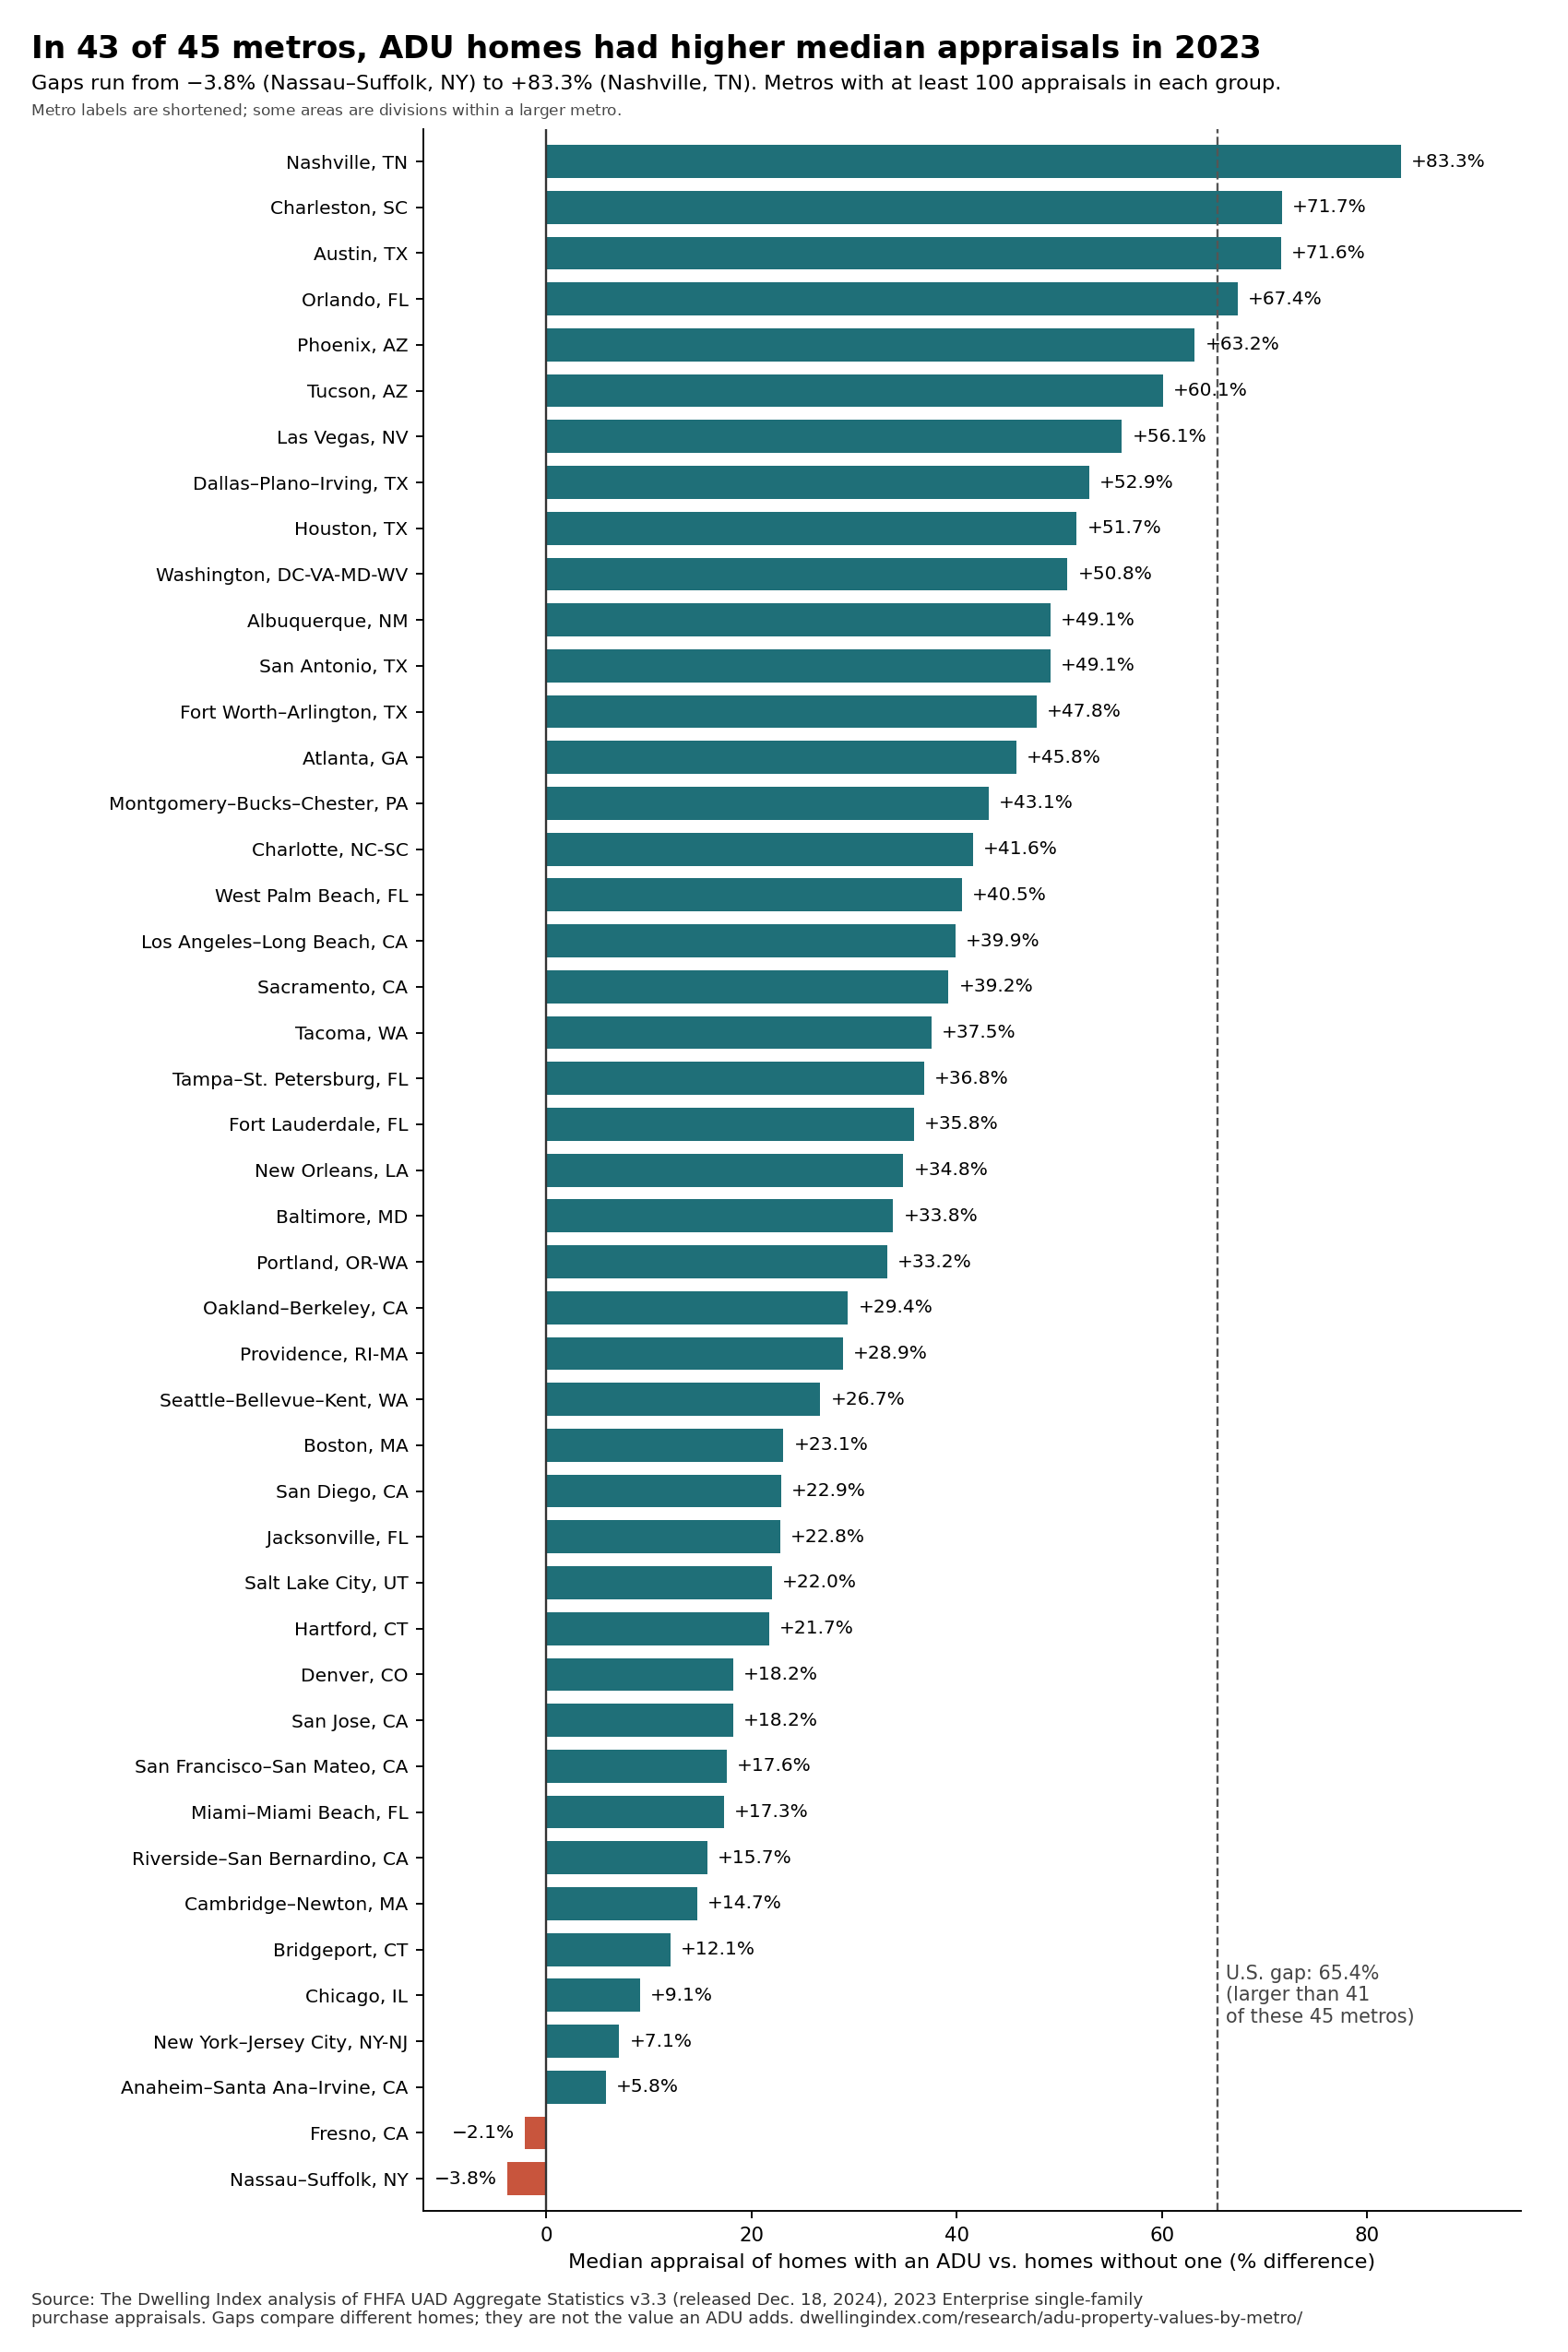
View all 45 bars as a responsive SVG
Find your metro
Type your metro's name or a city named in its label. Each row shows both medians, the gap in dollars and percent, and how many appraisals sit behind each median. Rows marked "Smaller group" have fewer than 100 appraisals on one side. Rows marked "Withheld by FHFA" are blank under the agency's small-group and related-cell privacy rules; a blank does not tell us which rule caused it. Source
| Group size | Copy | ||||||
|---|---|---|---|---|---|---|---|
| Akron, OH | $408,000 | $218,000 | $190,000 | +87.2% | 22 / 5,674 | Smaller group | |
| Albany-Schenectady-Troy, NY | $472,500 | $307,000 | $165,500 | +53.9% | 48 / 3,877 | Smaller group | |
| Albuquerque, NM | $510,000 | $342,000 | $168,000 | +49.1% | 104 / 6,274 | 100+ in each group | |
| Allentown-Bethlehem-Easton, PA-NJ | $550,000 | $324,000 | $226,000 | +69.8% | 44 / 6,122 | Smaller group | |
| Anaheim-Santa Ana-Irvine, CA (division) | $1,312,500 | $1,240,000 | $72,500 | +5.8% | 164 / 9,586 | 100+ in each group | |
| Atlanta-Sandy Springs-Alpharetta, GA | $605,000 | $415,000 | $190,000 | +45.8% | 771 / 55,496 | 100+ in each group | |
| Austin-Round Rock-Georgetown, TX | $832,500 | $485,000 | $347,500 | +71.6% | 250 / 24,047 | 100+ in each group | |
| Bakersfield, CA | $401,000 | $383,500 | $17,500 | +4.6% | 80 / 5,331 | Smaller group | |
| Baltimore-Columbia-Towson, MD | $535,000 | $400,000 | $135,000 | +33.8% | 204 / 18,601 | 100+ in each group | |
| Baton Rouge, LA | $337,000 | $270,000 | $67,000 | +24.8% | 55 / 4,970 | Smaller group | |
| Birmingham-Hoover, AL | $440,000 | $292,500 | $147,500 | +50.4% | 63 / 8,216 | Smaller group | |
| Boise City, ID | $750,000 | $461,500 | $288,500 | +62.5% | 61 / 7,732 | Smaller group | |
| Boston, MA (division) | $825,000 | $670,000 | $155,000 | +23.1% | 109 / 7,121 | 100+ in each group | |
| Bridgeport-Stamford-Norwalk, CT | $740,000 | $660,000 | $80,000 | +12.1% | 138 / 4,525 | 100+ in each group | |
| Buffalo-Cheektowaga, NY | $410,000 | $256,000 | $154,000 | +60.2% | 33 / 6,185 | Smaller group | |
| Cambridge-Newton-Framingham, MA (division) | $860,000 | $750,000 | $110,000 | +14.7% | 130 / 9,064 | 100+ in each group | |
| Camden, NJ (division) | $389,000 | $350,000 | $39,000 | +11.1% | 50 / 9,152 | Smaller group | |
| Cape Coral-Fort Myers, FL | $675,500 | $400,000 | $275,500 | +68.9% | 48 / 10,171 | Smaller group | |
| Charleston-North Charleston, SC | $790,000 | $460,000 | $330,000 | +71.7% | 125 / 8,274 | 100+ in each group | |
| Charlotte-Concord-Gastonia, NC-SC | $573,500 | $405,000 | $168,500 | +41.6% | 164 / 28,049 | 100+ in each group | |
| Chicago-Naperville-Evanston, IL (division) | $382,000 | $350,000 | $32,000 | +9.1% | 212 / 41,445 | 100+ in each group | |
| Cincinnati, OH-KY-IN | $420,000 | $300,000 | $120,000 | +40.0% | 39 / 17,172 | Smaller group | |
| Cleveland-Elyria, OH | $357,000 | $239,000 | $118,000 | +49.4% | 93 / 15,722 | Smaller group | |
| Colorado Springs, CO | $710,000 | $470,000 | $240,000 | +51.1% | 59 / 5,436 | Smaller group | |
| Columbia, SC | $382,000 | $275,000 | $107,000 | +38.9% | 56 / 6,475 | Smaller group | |
| Columbus, OH | $433,000 | $354,000 | $79,000 | +22.3% | 63 / 16,734 | Smaller group | |
| Dallas-Plano-Irving, TX (division) | $703,500 | $460,000 | $243,500 | +52.9% | 342 / 52,893 | 100+ in each group | |
| Dayton-Kettering, OH | Withheld by FHFA | Withheld by FHFA | Withheld by FHFA | Withheld by FHFA | Withheld by FHFA | Withheld by FHFA | |
| Denver-Aurora-Lakewood, CO | $732,500 | $619,500 | $113,000 | +18.2% | 164 / 25,699 | 100+ in each group | |
| Detroit-Dearborn-Livonia, MI (division) | $267,500 | $195,000 | $72,500 | +37.2% | 21 / 11,316 | Smaller group | |
| El Paso, TX | $248,000 | $260,000 | −$12,000 | −4.6% | 85 / 3,757 | Smaller group | |
| Elgin, IL (division) | Withheld by FHFA | Withheld by FHFA | Withheld by FHFA | Withheld by FHFA | Withheld by FHFA | Withheld by FHFA | |
| Fort Lauderdale-Pompano Beach-Sunrise, FL (division) | $720,000 | $530,000 | $190,000 | +35.8% | 125 / 12,533 | 100+ in each group | |
| Fort Worth-Arlington-Grapevine, TX (division) | $550,000 | $372,000 | $178,000 | +47.8% | 195 / 20,414 | 100+ in each group | |
| Frederick-Gaithersburg-Rockville, MD (division) | $702,000 | $600,000 | $102,000 | +17.0% | 67 / 7,708 | Smaller group | |
| Fresno, CA | $411,000 | $420,000 | −$9,000 | −2.1% | 102 / 5,951 | 100+ in each group | |
| Gary, IN (division) | Withheld by FHFA | Withheld by FHFA | Withheld by FHFA | Withheld by FHFA | Withheld by FHFA | Withheld by FHFA | |
| Grand Rapids-Kentwood, MI | $485,000 | $315,000 | $170,000 | +54.0% | 16 / 6,905 | Smaller group | |
| Greensboro-High Point, NC | $450,000 | $289,000 | $161,000 | +55.7% | 27 / 4,934 | Smaller group | |
| Greenville-Anderson, SC | $605,000 | $320,000 | $285,000 | +89.1% | 63 / 8,332 | Smaller group | |
| Hartford-East Hartford-Middletown, CT | $426,000 | $350,000 | $76,000 | +21.7% | 117 / 6,878 | 100+ in each group | |
| Houston-The Woodlands-Sugar Land, TX | $540,000 | $356,000 | $184,000 | +51.7% | 638 / 58,720 | 100+ in each group | |
| Indianapolis-Carmel-Anderson, IN | $370,000 | $318,000 | $52,000 | +16.4% | 84 / 21,661 | Smaller group | |
| Jacksonville, FL | $485,000 | $395,000 | $90,000 | +22.8% | 127 / 15,079 | 100+ in each group | |
| Kansas City, MO-KS | $455,000 | $316,000 | $139,000 | +44.0% | 58 / 18,672 | Smaller group | |
| Knoxville, TN | $410,000 | $360,000 | $50,000 | +13.9% | 66 / 6,930 | Smaller group | |
| Lake County-Kenosha County, IL-WI (division) | Withheld by FHFA | Withheld by FHFA | Withheld by FHFA | Withheld by FHFA | Withheld by FHFA | Withheld by FHFA | |
| Las Vegas-Henderson-Paradise, NV | $702,500 | $450,000 | $252,500 | +56.1% | 144 / 20,832 | 100+ in each group | |
| Little Rock-North Little Rock-Conway, AR | $315,000 | $245,000 | $70,000 | +28.6% | 43 / 5,117 | Smaller group | |
| Los Angeles-Long Beach-Glendale, CA (division) | $1,280,000 | $915,000 | $365,000 | +39.9% | 1,206 / 25,170 | 100+ in each group | |
| Louisville/Jefferson County, KY-IN | $280,000 | $278,000 | $2,000 | +0.7% | 35 / 10,055 | Smaller group | |
| Memphis, TN-MS-AR | $404,000 | $295,000 | $109,000 | +36.9% | 71 / 8,465 | Smaller group | |
| Miami-Miami Beach-Kendall, FL (division) | $650,000 | $554,000 | $96,000 | +17.3% | 282 / 12,191 | 100+ in each group | |
| Milwaukee-Waukesha, WI | Withheld by FHFA | Withheld by FHFA | Withheld by FHFA | Withheld by FHFA | Withheld by FHFA | Withheld by FHFA | |
| Minneapolis-St. Paul-Bloomington, MN-WI | $459,500 | $382,000 | $77,500 | +20.3% | 92 / 28,840 | Smaller group | |
| Montgomery County-Bucks County-Chester County, PA (division) | $694,000 | $485,000 | $209,000 | +43.1% | 137 / 13,671 | 100+ in each group | |
| Nashville-Davidson-Murfreesboro-Franklin, TN | $843,000 | $460,000 | $383,000 | +83.3% | 213 / 20,247 | 100+ in each group | |
| Nassau County-Suffolk County, NY (division) | $625,000 | $650,000 | −$25,000 | −3.8% | 642 / 14,886 | 100+ in each group | |
| New Haven-Milford, CT | $470,000 | $355,000 | $115,000 | +32.4% | 76 / 4,124 | Smaller group | |
| New Orleans-Metairie, LA | $399,000 | $296,000 | $103,000 | +34.8% | 125 / 5,791 | 100+ in each group | |
| New York-Jersey City-White Plains, NY-NJ (division) | $750,000 | $700,000 | $50,000 | +7.1% | 351 / 18,179 | 100+ in each group | |
| Newark, NJ-PA (division) | $720,000 | $560,000 | $160,000 | +28.6% | 86 / 12,081 | Smaller group | |
| North Port-Sarasota-Bradenton, FL | $715,000 | $495,000 | $220,000 | +44.4% | 83 / 11,068 | Smaller group | |
| Oakland-Berkeley-Livermore, CA (division) | $1,300,000 | $1,005,000 | $295,000 | +29.4% | 351 / 13,334 | 100+ in each group | |
| Oklahoma City, OK | $440,500 | $270,000 | $170,500 | +63.1% | 84 / 9,861 | Smaller group | |
| Omaha-Council Bluffs, NE-IA | $285,000 | $303,000 | −$18,000 | −5.9% | 13 / 7,867 | Smaller group | |
| Orlando-Kissimmee-Sanford, FL | $730,000 | $436,000 | $294,000 | +67.4% | 325 / 26,719 | 100+ in each group | |
| Oxnard-Thousand Oaks-Ventura, CA | $1,225,000 | $885,000 | $340,000 | +38.4% | 87 / 2,868 | Smaller group | |
| Philadelphia, PA (division) | $570,000 | $300,000 | $270,000 | +90.0% | 49 / 12,724 | Smaller group | |
| Phoenix-Mesa-Chandler, AZ | $775,000 | $475,000 | $300,000 | +63.2% | 587 / 41,778 | 100+ in each group | |
| Pittsburgh, PA | $223,000 | $250,000 | −$27,000 | −10.8% | 92 / 16,173 | Smaller group | |
| Portland-Vancouver-Hillsboro, OR-WA | $746,000 | $560,000 | $186,000 | +33.2% | 265 / 14,776 | 100+ in each group | |
| Providence-Warwick, RI-MA | $580,000 | $450,000 | $130,000 | +28.9% | 155 / 6,783 | 100+ in each group | |
| Raleigh-Cary, NC | $660,000 | $455,000 | $205,000 | +45.1% | 43 / 16,642 | Smaller group | |
| Richmond, VA | $453,000 | $380,000 | $73,000 | +19.2% | 54 / 11,174 | Smaller group | |
| Riverside-San Bernardino-Ontario, CA | $665,000 | $575,000 | $90,000 | +15.7% | 553 / 27,067 | 100+ in each group | |
| Rochester, NY | $396,500 | $242,500 | $154,000 | +63.5% | 54 / 5,804 | Smaller group | |
| Sacramento-Roseville-Folsom, CA | $820,000 | $589,000 | $231,000 | +39.2% | 303 / 17,046 | 100+ in each group | |
| Salt Lake City, UT | $668,500 | $548,000 | $120,500 | +22.0% | 188 / 7,874 | 100+ in each group | |
| San Antonio-New Braunfels, TX | $492,000 | $330,000 | $162,000 | +49.1% | 252 / 17,836 | 100+ in each group | |
| San Diego-Chula Vista-Carlsbad, CA | $1,200,000 | $976,500 | $223,500 | +22.9% | 453 / 10,291 | 100+ in each group | |
| San Francisco-San Mateo-Redwood City, CA (division) | $1,835,000 | $1,560,000 | $275,000 | +17.6% | 196 / 3,786 | 100+ in each group | |
| San Jose-Sunnyvale-Santa Clara, CA | $1,878,500 | $1,589,000 | $289,500 | +18.2% | 258 / 7,026 | 100+ in each group | |
| Seattle-Bellevue-Kent, WA (division) | $1,090,000 | $860,000 | $230,000 | +26.7% | 510 / 17,505 | 100+ in each group | |
| St. Louis, MO-IL | $340,000 | $275,000 | $65,000 | +23.6% | 55 / 24,116 | Smaller group | |
| Stockton, CA | $903,000 | $608,000 | $295,000 | +48.5% | 96 / 5,851 | Smaller group | |
| Syracuse, NY | Withheld by FHFA | Withheld by FHFA | Withheld by FHFA | Withheld by FHFA | Withheld by FHFA | Withheld by FHFA | |
| Tacoma-Lakewood, WA (division) | $756,000 | $550,000 | $206,000 | +37.5% | 125 / 5,458 | 100+ in each group | |
| Tampa-St. Petersburg-Clearwater, FL | $554,000 | $405,000 | $149,000 | +36.8% | 374 / 29,759 | 100+ in each group | |
| Tucson, AZ | $600,000 | $374,700 | $225,300 | +60.1% | 182 / 6,790 | 100+ in each group | |
| Tulsa, OK | $320,000 | $274,000 | $46,000 | +16.8% | 78 / 6,975 | Smaller group | |
| Urban Honolulu, HI | $1,262,500 | $1,064,500 | $198,000 | +18.6% | 58 / 1,254 | Smaller group | |
| Virginia Beach-Norfolk-Newport News, VA-NC | $591,800 | $355,000 | $236,800 | +66.7% | 90 / 7,969 | Smaller group | |
| Warren-Troy-Farmington Hills, MI (division) | $510,000 | $305,000 | $205,000 | +67.2% | 37 / 18,798 | Smaller group | |
| Washington-Arlington-Alexandria, DC-VA-MD-WV (division) | $895,000 | $593,500 | $301,500 | +50.8% | 422 / 27,675 | 100+ in each group | |
| West Palm Beach-Boca Raton-Boynton Beach, FL (division) | $772,500 | $550,000 | $222,500 | +40.5% | 240 / 11,119 | 100+ in each group | |
| Wichita, KS | Withheld by FHFA | Withheld by FHFA | Withheld by FHFA | Withheld by FHFA | Withheld by FHFA | Withheld by FHFA | |
| Wilmington, DE-MD-NJ (division) | $491,000 | $367,000 | $124,000 | +33.8% | 36 / 5,009 | Smaller group | |
| Winston-Salem, NC | $607,500 | $295,000 | $312,500 | +105.9% | 24 / 4,954 | Smaller group | |
| Worcester, MA-CT | $550,000 | $435,000 | $115,000 | +26.4% | 87 / 5,167 | Smaller group | |
| Source: The Dwelling Index analysis of FHFA UAD Aggregate Statistics, Enterprise single-family purchase appraisals, 2023 (version 3.3, released Dec. 18, 2024; checked Sept. 29, 2026). Gap % = (median with ADU − median without) ÷ median without × 100. "(division)" marks a metropolitan division, a piece of a larger metro. Gaps compare different homes; they are not the value an ADU adds. | |||||||
Gap $ = median with ADU − median without ADU; gap % = gap $ ÷ median without ADU × 100, rounded half up to one decimal. Gap-percent sorting uses the six-decimal CSV sort key to preserve the audited order; it does not imply extra measurement precision.
Which metros have the biggest gaps between homes with and without ADUs?
Nashville had the biggest gap among the 45 metros with at least 100 appraisals per group in 2023: $843,000 with an ADU vs. $460,000 without, or 83.3%. Charleston, S.C. (71.7%), and Austin (71.6%) came next. These rank gaps between groups of homes, not the payoff from building an ADU.
| Rank | Metro area | With ADU | Without ADU | Gap ($) | Gap (%) | Appraisals with / without ADU |
|---|---|---|---|---|---|---|
| 1 | Nashville-Davidson-Murfreesboro-Franklin, TN | $843,000 | $460,000 | $383,000 | +83.3% | 213 / 20,247 |
| 2 | Charleston-North Charleston, SC | $790,000 | $460,000 | $330,000 | +71.7% | 125 / 8,274 |
| 3 | Austin-Round Rock-Georgetown, TX | $832,500 | $485,000 | $347,500 | +71.6% | 250 / 24,047 |
| 4 | Orlando-Kissimmee-Sanford, FL | $730,000 | $436,000 | $294,000 | +67.4% | 325 / 26,719 |
| 5 | Phoenix-Mesa-Chandler, AZ | $775,000 | $475,000 | $300,000 | +63.2% | 587 / 41,778 |
| 6 | Tucson, AZ | $600,000 | $374,700 | $225,300 | +60.1% | 182 / 6,790 |
| 7 | Las Vegas-Henderson-Paradise, NV | $702,500 | $450,000 | $252,500 | +56.1% | 144 / 20,832 |
| 8 | Dallas-Plano-Irving, TX (division) | $703,500 | $460,000 | $243,500 | +52.9% | 342 / 52,893 |
| 9 | Houston-The Woodlands-Sugar Land, TX | $540,000 | $356,000 | $184,000 | +51.7% | 638 / 58,720 |
| 10 | Washington-Arlington-Alexandria, DC-VA-MD-WV (division) | $895,000 | $593,500 | $301,500 | +50.8% | 422 / 27,675 |
| Source: The Dwelling Index analysis of FHFA UAD Aggregate Statistics, 2023 Enterprise single-family purchase appraisals. Metros with at least 100 appraisals in each group. | ||||||
In dollars, the order of those 45 metros shifts a little. Nashville still leads at $383,000, then Los Angeles–Long Beach–Glendale ($365,000), Austin ($347,500), and Charleston ($330,000).
Say a builder quotes you $250,000 for a backyard cottage in Nashville. It's tempting to subtract that from $383,000 and call the rest profit. Don't. The $383,000 compares two different groups of houses, on different lots, in different neighborhoods.
Do homes with ADUs always appraise higher?
No. Among the 45 metros with at least 100 appraisals per group, homes with an ADU had a lower median appraisal in two: Nassau–Suffolk, N.Y. (−3.8%) and Fresno, Calif. (−2.1%). Across all 93 metros with published numbers, five gaps were negative.
| Metro area | With ADU | Without ADU | Gap ($) | Gap (%) | Appraisals with / without ADU | Group size |
|---|---|---|---|---|---|---|
| Pittsburgh, PA | $223,000 | $250,000 | −$27,000 | −10.8% | 92 / 16,173 | Smaller group |
| Omaha-Council Bluffs, NE-IA | $285,000 | $303,000 | −$18,000 | −5.9% | 13 / 7,867 | Smaller group |
| El Paso, TX | $248,000 | $260,000 | −$12,000 | −4.6% | 85 / 3,757 | Smaller group |
| Nassau County-Suffolk County, NY (division) | $625,000 | $650,000 | −$25,000 | −3.8% | 642 / 14,886 | 100+ in each group |
| Fresno, CA | $411,000 | $420,000 | −$9,000 | −2.1% | 102 / 5,951 | 100+ in each group |
| Source: The Dwelling Index analysis of FHFA UAD Aggregate Statistics, 2023 Enterprise single-family purchase appraisals. | ||||||
Nassau–Suffolk is the surprise. It has one of the highest ADU shares in this purchase-appraisal sample (see the next section) and the most ADU appraisals among the 93 published metro rows outside Los Angeles and Atlanta. Yet the typical ADU home there appraised $25,000 lower.
Smaller groups give us fewer homes to compare. Winston-Salem, N.C., shows the biggest gap of all, +105.9%, but that rests on just 24 appraisals of homes with an ADU. Omaha's −5.9% rests on 13. That's why the headline numbers use only the 45 metros with at least 100 appraisals in each group.
A lower median doesn't mean an ADU hurts value. It means the ADU homes that happened to get purchase appraisals there in 2023 had a lower middle value than the rest.
Where are ADUs most common in purchase appraisals?
In the San Francisco–San Mateo–Redwood City division, 4.9% of FHFA's 2023 purchase appraisals with known ADU status involved a home with an ADU — the highest share among the 45 metros with at least 100 appraisals per group. Nationally it was 1.2%, about 1 in 80. The Chicago area was lowest of the 45, at 0.5%.
| Metro area | Share of purchase appraisals with an ADU | Appraisals with / without ADU | Gap (%) |
|---|---|---|---|
| San Francisco-San Mateo-Redwood City, CA (division) | 4.9% | 196 / 3,786 | +17.6% |
| Los Angeles-Long Beach-Glendale, CA (division) | 4.6% | 1,206 / 25,170 | +39.9% |
| San Diego-Chula Vista-Carlsbad, CA | 4.2% | 453 / 10,291 | +22.9% |
| Nassau County-Suffolk County, NY (division) | 4.1% | 642 / 14,886 | −3.8% |
| San Jose-Sunnyvale-Santa Clara, CA | 3.5% | 258 / 7,026 | +18.2% |
| Chicago-Naperville-Evanston, IL (division), lowest of the 45 | 0.5% | 212 / 41,445 | +9.1% |
| United States | 1.2% | 25,888 / 2,053,409 | +65.4% |
Sources: The Dwelling Index analysis of FHFA UAD Aggregate Statistics metro and national files, 2023 Enterprise single-family purchase appraisals. Share = appraisals with an ADU ÷ (with + without). Appraisals with missing ADU status are not counted in these shares.
Four of the top five are in California. Los Angeles stands out by sheer size: 1,206 of the nation's 25,888 ADU purchase appraisals came from the Los Angeles–Long Beach–Glendale area. That's 4.7%. For homes without an ADU, the same area supplied about 1 in 82.
Listings tell a different story because they count differently. Freddie Mac scanned real estate listing text and found that 4.2% of homes sold in its multiple-listing-service data in 2019 mentioned an ADU. Source Listing text can include units that were never permitted, and appraisals flag an ADU only when the appraiser marks it. For more counts like these, see our ADU statistics.
How do California metros compare?
California's 12 metro areas in the table don't share one gap. In 2023, San Diego's was 22.9%, Anaheim–Santa Ana–Irvine's was 5.8%, and Fresno's was −2.1%. Statewide, FHFA's v3.3 data file reports a median of $1,063,000 with an ADU and $715,000 without — a 48.7% gap.
| California area | With ADU | Without ADU | Gap ($) | Gap (%) | Appraisals with / without ADU | Group size |
|---|---|---|---|---|---|---|
| Stockton, CA | $903,000 | $608,000 | $295,000 | +48.5% | 96 / 5,851 | Smaller group |
| Los Angeles-Long Beach-Glendale, CA (division) | $1,280,000 | $915,000 | $365,000 | +39.9% | 1,206 / 25,170 | 100+ in each group |
| Sacramento-Roseville-Folsom, CA | $820,000 | $589,000 | $231,000 | +39.2% | 303 / 17,046 | 100+ in each group |
| Oxnard-Thousand Oaks-Ventura, CA | $1,225,000 | $885,000 | $340,000 | +38.4% | 87 / 2,868 | Smaller group |
| Oakland-Berkeley-Livermore, CA (division) | $1,300,000 | $1,005,000 | $295,000 | +29.4% | 351 / 13,334 | 100+ in each group |
| San Diego-Chula Vista-Carlsbad, CA | $1,200,000 | $976,500 | $223,500 | +22.9% | 453 / 10,291 | 100+ in each group |
| San Jose-Sunnyvale-Santa Clara, CA | $1,878,500 | $1,589,000 | $289,500 | +18.2% | 258 / 7,026 | 100+ in each group |
| San Francisco-San Mateo-Redwood City, CA (division) | $1,835,000 | $1,560,000 | $275,000 | +17.6% | 196 / 3,786 | 100+ in each group |
| Riverside-San Bernardino-Ontario, CA | $665,000 | $575,000 | $90,000 | +15.7% | 553 / 27,067 | 100+ in each group |
| Anaheim-Santa Ana-Irvine, CA (division) | $1,312,500 | $1,240,000 | $72,500 | +5.8% | 164 / 9,586 | 100+ in each group |
| Bakersfield, CA | $401,000 | $383,500 | $17,500 | +4.6% | 80 / 5,331 | Smaller group |
| Fresno, CA | $411,000 | $420,000 | −$9,000 | −2.1% | 102 / 5,951 | 100+ in each group |
| California, statewide (FHFA v3.3) | $1,063,000 | $715,000 | $348,000 | +48.7% | 4,909 / 161,730 | Statewide |
Sources: The Dwelling Index analysis of FHFA UAD Aggregate Statistics v3.3, 2023 Enterprise single-family purchase appraisals: metro file and state file. The statewide median comes from the state file, not an average of metro medians.
Why you may see $1,064,000 elsewhere: FHFA's Jan. 2, 2025 blog reports $1,064,000 and 4,910 ADU appraisals; its downloadable v3.3 state file gives $1,063,000 and 4,909. Both give $715,000 without an ADU. We could not establish why they differ. This page uses the data file consistently; the California source-comparison CSV preserves both. The blog figures produce a $349,000 (48.8%) gap; the file figures produce $348,000 (48.7%).
Price and gap are two different questions. San Jose has the highest ADU-home median in the whole table, $1,878,500, but its gap is 18.2%. Nashville's ADU-home median is less than half that, and its gap is 83.3%.
Together, these 12 areas hold 3,849 of the 4,909 ADU purchase appraisals in FHFA's state file for California in 2023, or 78.4%. The rest come from places outside these 12 areas.
Why is the U.S. gap bigger than most metros' gaps?
The U.S. gap in 2023 was 65.4% ($645,000 with an ADU vs. $390,000 without). That's bigger than the gap inside 41 of the 45 larger-group metros. The two national groups include different mixes of homes and places.
The 12 California areas in this table held 14.9% of FHFA's national ADU purchase appraisals in 2023 but only 6.5% of the appraisals without one. That mix can affect a national median. This analysis does not measure how much of the national gap it explains.
Think of it like this. If most of the ADU homes in a pile come from Los Angeles and San Diego, and most of the others come from cheaper towns, the ADU pile will look expensive — even if the gap inside each town is modest.
Use the national figure for a national sentence. Use your metro's row for anything local. The 65.4% national gap and the 34.8% typical-metro gap answer different questions; neither corrects the other.
How have ADU home values changed since 2013?
The U.S. median appraisal for homes with an ADU rose from $375,000 in 2013 to $645,000 in 2023, up 72.0%. For homes without one, it rose from $240,000 to $390,000, up 62.5%. Each year's groups are different homes, so this isn't the growth of any one house.
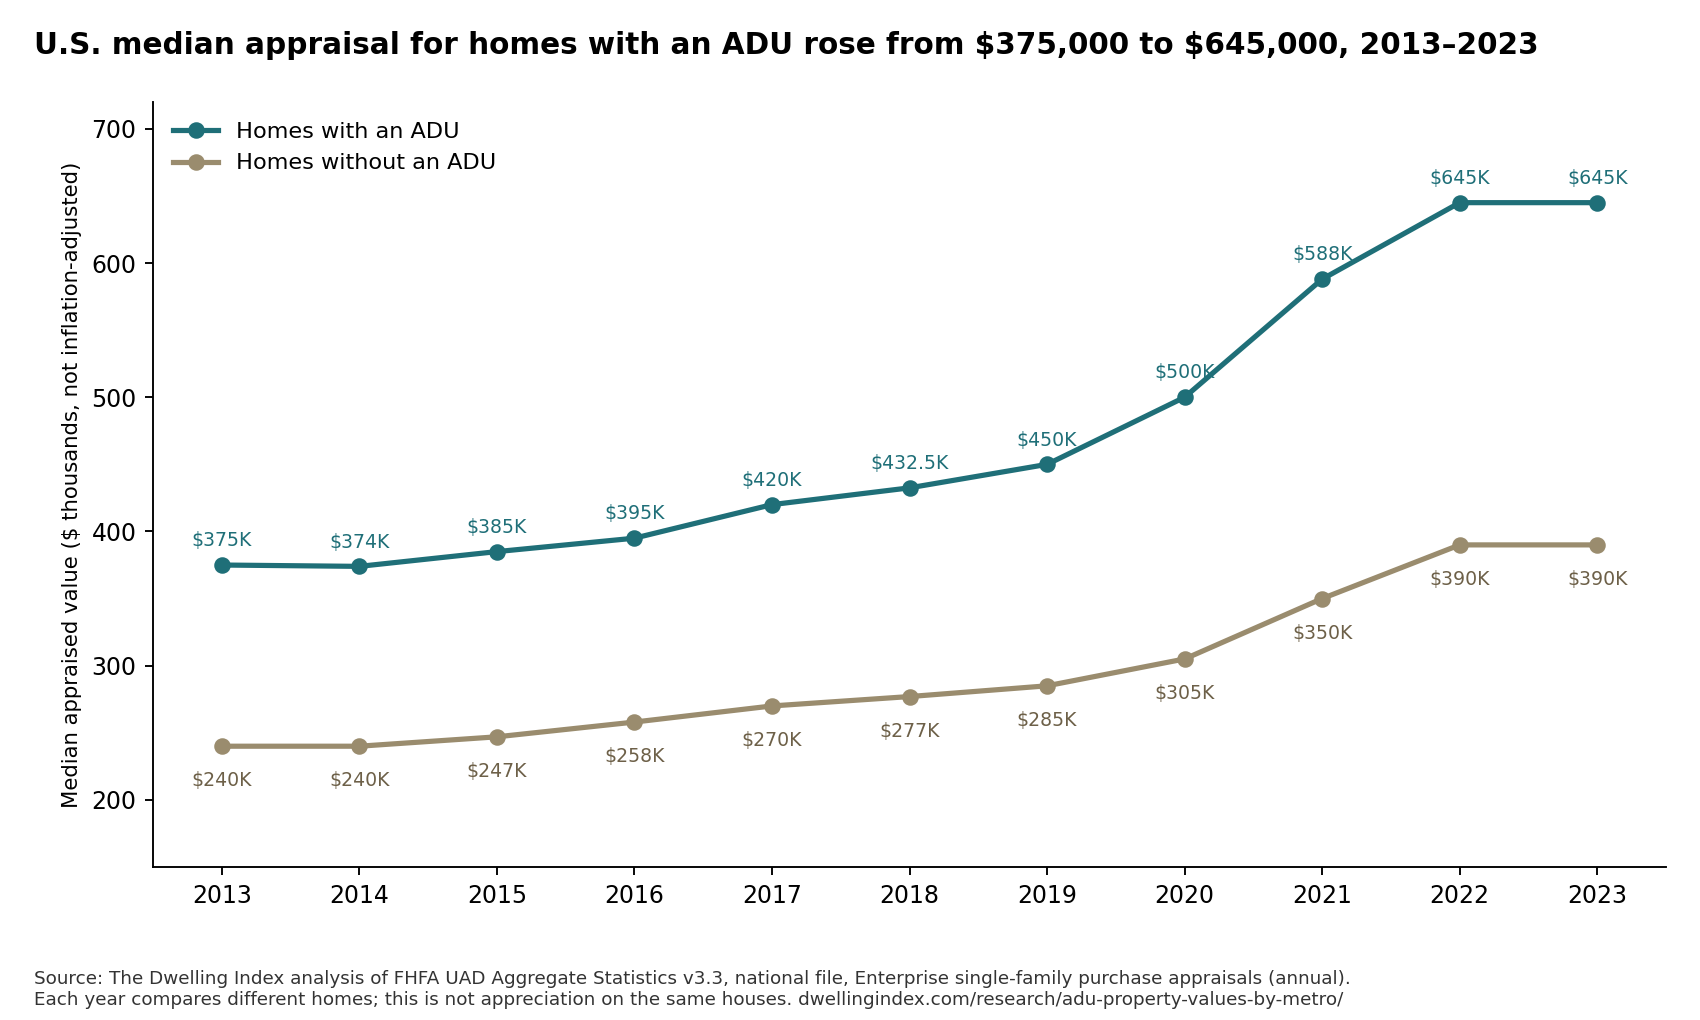
| Year | With ADU | Without ADU | Gap (%) | Appraisals with ADU | Share with ADU |
|---|---|---|---|---|---|
| 2013 | $375,000 | $240,000 | +56.3% | 15,774 | 0.91% |
| 2014 | $374,000 | $240,000 | +55.8% | 16,982 | 0.92% |
| 2015 | $385,000 | $247,000 | +55.9% | 20,410 | 0.93% |
| 2016 | $395,000 | $258,000 | +53.1% | 23,279 | 0.98% |
| 2017 | $420,000 | $270,000 | +55.6% | 27,091 | 1.06% |
| 2018 | $432,500 | $277,000 | +56.1% | 29,311 | 1.09% |
| 2019 | $450,000 | $285,000 | +57.9% | 31,990 | 1.14% |
| 2020 | $500,000 | $305,000 | +63.9% | 39,422 | 1.24% |
| 2021 | $588,000 | $350,000 | +68.0% | 46,588 | 1.35% |
| 2022 | $645,000 | $390,000 | +65.4% | 35,151 | 1.29% |
| 2023 | $645,000 | $390,000 | +65.4% | 25,888 | 1.25% |
| Source: The Dwelling Index analysis of FHFA UAD Aggregate Statistics, national file, Enterprise single-family purchase appraisals, annual. Share = appraisals with an ADU ÷ (with + without). | |||||
Two more things stand out. ADU purchase appraisals in this national series peaked at 46,588 in 2021, then fell, as did the count without an ADU. And the share of appraisals with an ADU climbed from 0.91% in 2013 to 1.25% in 2023.
If you quote FHFA's own growth figures, distinguish them from compound growth. FHFA's California blog reports "annualized growth" of 7.20% a year for U.S. homes with an ADU and 6.25% for homes without. Those equal the total rise divided by 10: 72.0% ÷ 10 and 62.5% ÷ 10. Compounded year over year, the same totals work out to about 5.6% and 5.0% a year.
Does an ADU add the amount shown in this table?
No. The gaps compare different homes, not the same home before and after an ADU. A peer-reviewed study of city of Los Angeles parcels reported preferred estimates of 7% to 9% for ADU-related assessed-value and sale-price differences. Source
That study, by economists Jan K. Brueckner and Sarah Thomaz, used Los Angeles parcel data from 2013 to 2019. It compared homes while accounting for traits such as bedroom and bathroom counts — the kind of thing a raw gap can't do. An earlier UC Irvine working paper by Thomaz had estimated about 50%; the published 2024 version reports 7% to 9% in the models the authors favored. Those models allow a year after the ADU permit and account for small-area neighborhood differences. The study uses permits as a stand-in for built ADUs and cannot rule out all unmeasured differences between homes. Its 7%–9% summary is not the full range of model results or a confidence interval.
Put it side by side. In the Los Angeles–Long Beach–Glendale division, the raw 2023 gap in our table is 39.9%. The published study's preferred city of Los Angeles estimates are 7% to 9%, using 2013–2019 data. The places, years, and methods differ. Subtracting one from the other cannot tell us how much of the 2023 gap comes from the ADU itself.
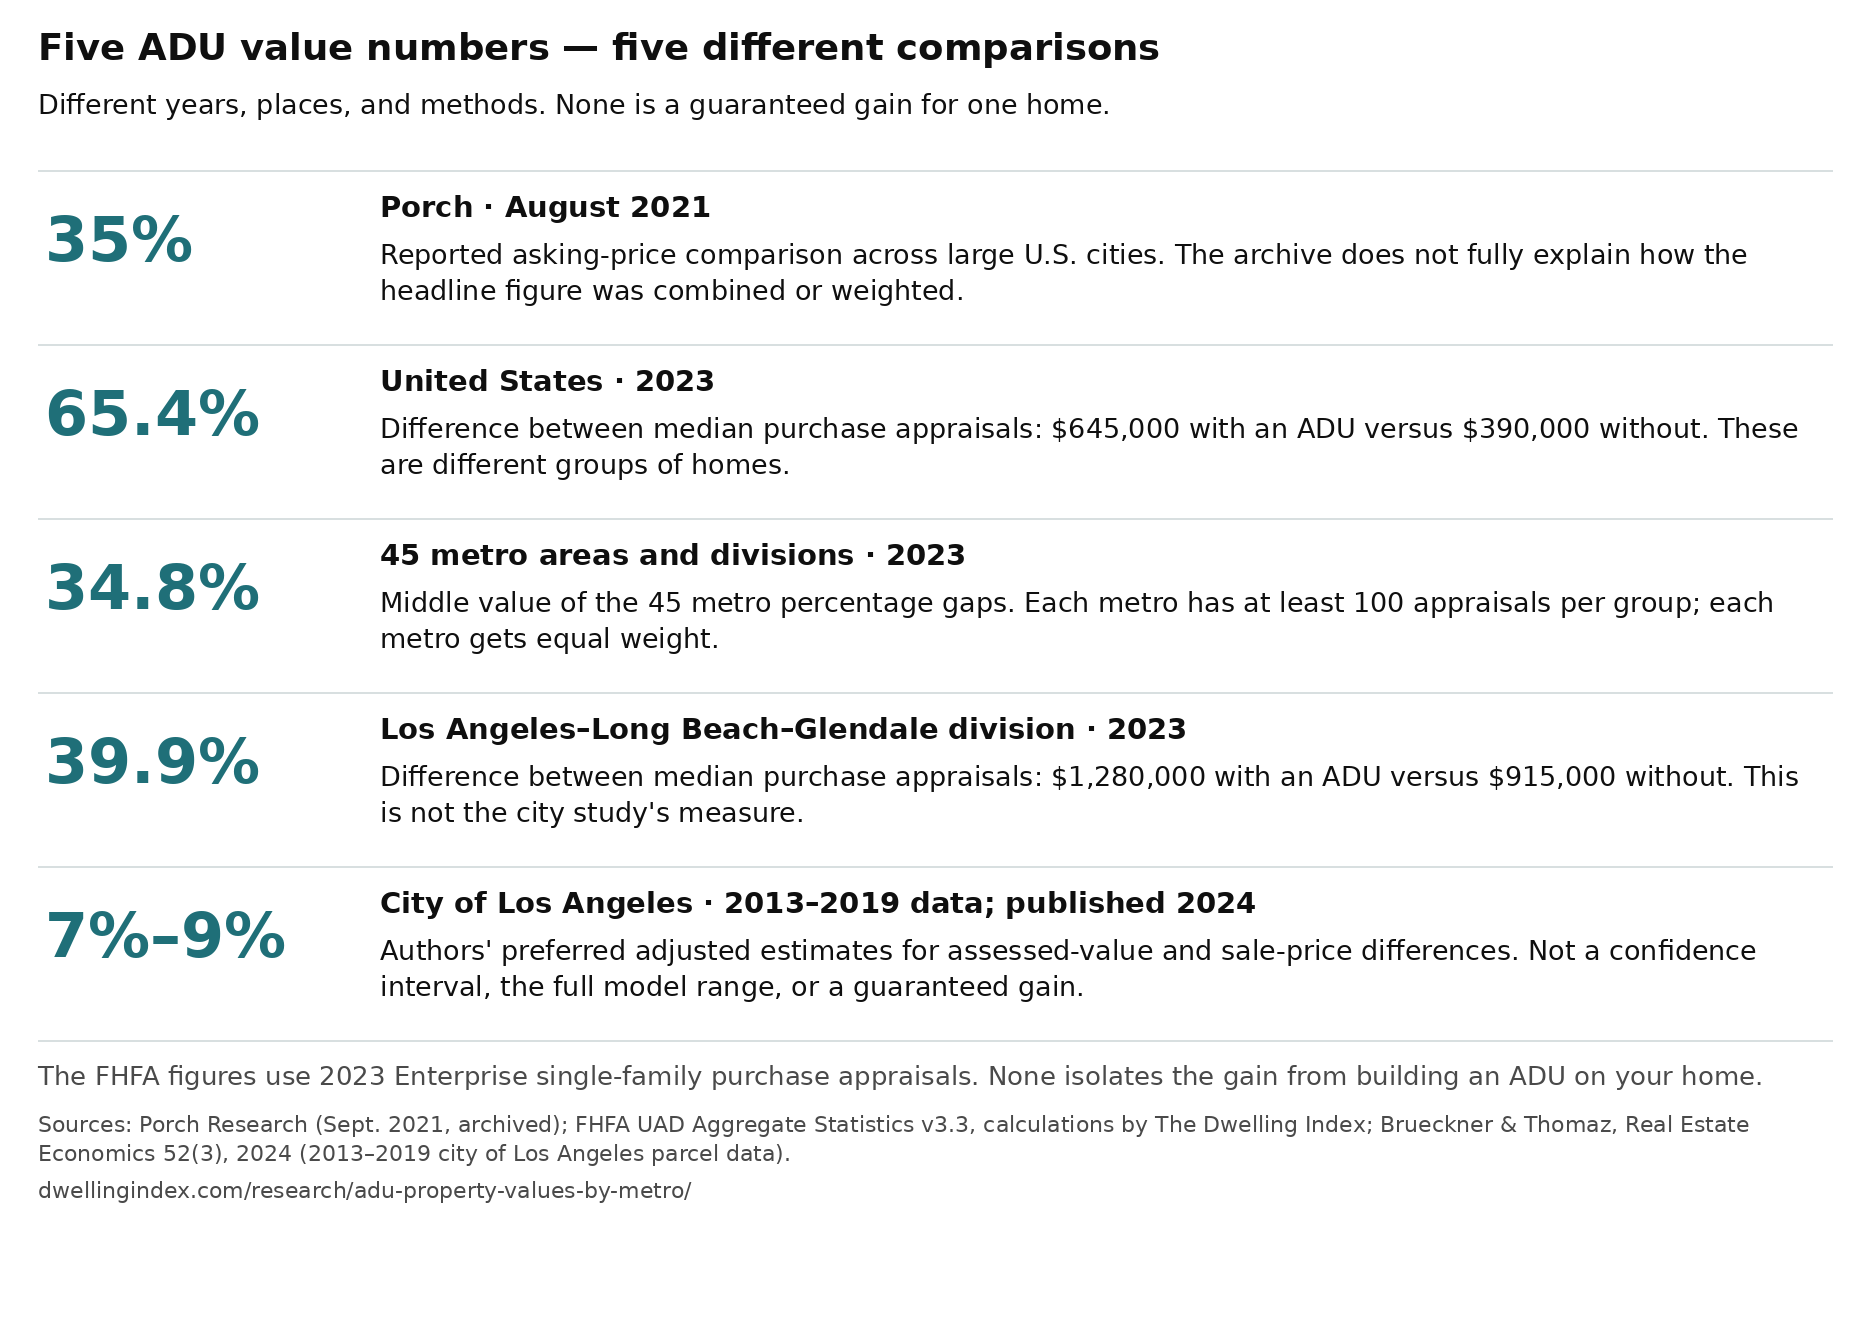
Appraisal, sale price, assessed value, and building cost are four different numbers
| Number | What it is | In this table? |
|---|---|---|
| Appraised value | An appraiser's opinion of what a home is worth, made here for a loan | Yes |
| Sale price | What a buyer actually paid | No |
| Assessed value | The value a local government uses to figure property tax | No |
| Building cost | What it costs to design, permit, and build an ADU | No |
Definitions: CFPB on appraisals and Brueckner and Thomaz on assessed values and sale prices. Building cost is the project-cost category used here. The FHFA comparison measures appraised values only.
For how an appraiser handles an ADU on a single home, see how appraisers value an ADU.
Where does the "ADUs add 35%" number come from?
From a 2021 Porch Research study. It compared asking prices of Trulia listings with ADUs against each city's median listing price in August 2021. Its method names the 500 biggest U.S. cities, but does not fully explain how the headline 35% was combined or weighted. We verified that Porch reported it, not that the aggregate can be reproduced. It did not measure appraisals, completed sales, or the same home before and after construction. The original page is now offline. Archived source
HomeLight credits the 35% to a National Association of Realtors study. NAR's own article credits Porch. The data came from Porch. On Sept. 29, 2026, Porch's original page returned a "not found" error; an archived copy from Feb. 1, 2022, still shows the study.
The same report had warning signs built in. Porch reported listings with ADUs at 2% to 3% less than each city's typical price in Long Beach, Calif., and Miami, and about three times the typical price in Savannah, Ga., and Cleveland. Those are Porch's reported figures, not recalculated results here. Gaps that wide don't tell any one homeowner much.
By coincidence, the typical metro gap in our 2023 appraisal data — 34.8% — lands close to 35%. That doesn't rescue the claim. Both numbers compare different homes. Neither measures what building an ADU adds.
| Number you'll see | Where it came from | What it measured | Good for |
|---|---|---|---|
| "ADUs add 35%" | Porch Research, Sept. 2021 (archived) | Reported asking-price comparison against city medians, August 2021; aggregate not independently reproduced | History only |
| "Multiply your home's value by 0.30" | RenoFi and HomeLight articles; neither supplies a reproducible study for this rule | A stated rule of thumb, not a documented measurement | Not a property-specific valuation |
| "About 50%" | UC Irvine working paper (Thomaz) | Early Los Angeles estimate | Replaced by the published 7%–9% |
| "7% to 9%" | Brueckner and Thomaz, Real Estate Economics, 2024 | Authors' preferred adjusted estimates from 2013–2019 city of Los Angeles parcel data | A local model result, not a guaranteed gain or the full range of estimates |
| "48.7% in California" | FHFA v3.3 state file, gap by The Dwelling Index | Median appraisals, homes with vs. without an ADU, 2023 | A statewide gap; the blog's different figures give 48.8% |
| "−3.8% to +83.3%" | This page | Median appraisals, homes with vs. without an ADU, 45 metros with 100+ appraisals per group, 2023 | Local gaps between groups |
| "65.4% nationally" | FHFA national file, gap by The Dwelling Index | $645,000 vs. $390,000 median purchase appraisals, 2023 | A national gap between groups |
| "34.8% in the typical metro" | FHFA metro file, calculation by The Dwelling Index | Median of 45 metro gaps with at least 100 appraisals per group, 2023 | An equally weighted metro comparison |
| "39.9% in the Los Angeles division" | FHFA metro file, gap by The Dwelling Index | $1,280,000 vs. $915,000 in Los Angeles–Long Beach–Glendale, 2023 | A division-level gap, not the city study's estimate |
Sources as linked; all checked Sept. 29, 2026.
What should you use instead of a flat percentage?
Use your metro's row as local context, not a price tag. The gap tells you how homes with ADUs compared with other homes in 2023. It can't tell you what an ADU will add to your house.
What you'll actually want to know are three things the table can't answer. First, what it costs to build: see what an ADU costs, all in. Second, what it could earn: see the ADU rental income guide. Third, how you'd pay for it: compare ADU financing options.
If you're weighing an ADU for your own lot, Check My Property is our free starting point for what your address may allow, with rough costs and ways to pay. Confirm any project-specific value with a qualified local appraiser.
Why is this 2023 data?
Because 2023 is the newest full year in the FHFA UAD Aggregate Statistics release used here. Its latest release, version 3.3 from Dec. 18, 2024, covers yearly data from 2013 through 2023; we checked on Sept. 29, 2026. September 2026 is when we ran this analysis, not when these homes were appraised.
FHFA also posts quarterly numbers into 2024. We used full years so every metro is measured the same way. When FHFA publishes a newer full year, we'll rerun every row.
How did we build this?
We took FHFA's published 2023 medians and appraisal counts for homes marked with and without an ADU, for all 100 metro areas in its file. Then we computed each gap using the no-ADU median as the base. We kept all 100 areas, including the seven FHFA withheld.
What we pulled
- Source: FHFA Uniform Appraisal Dataset (UAD) Aggregate Statistics, Enterprise single-family metro, national, and state files (version 3.3, released Dec. 18, 2024). The state file supplies the California row.
- Filters: year 2023 for metro rows and California; years 2013–2023 for the national series. In each file: quarter code 5 (all four quarters); loan purpose "Purchase"; characteristic "Accessory Dwelling Unit Present"; categories "Yes" and "No"; statistics "COUNT" and "MEDIAN." Select California with STATEPOSTAL="CA". Require APPRAISALSOURCE="Enterprise Single Family". Require SUPPRESSED=0 for a published value; retain suppressed rows as blank. The source labels FREQUENCY as "Quarterly" even for annual rows, so do not filter on "Annual." Field definitions
- Missing ADU status: excluded from with/without comparisons and share denominators (463 nationally in 2023). We retain national missing-status counts as a separate CSV field; they are not zeros or no-ADU homes.
- Rounding: FHFA rounds medians to the nearest $100. We round gaps half up to one decimal. Shares use two decimals in the CSV and Table 6, and one decimal in Table 4. Always round from the count ratio, not an already rounded share: the U.S. 2023 share is 1.2% to one decimal and 1.25% to two. The extra decimals in our math don't make FHFA's medians more precise. Source definitions
The math
Gap in dollars = median with an ADU − median without. Gap in percent = gap in dollars ÷ median without × 100.
Nashville: $843,000 − $460,000 = $383,000. Then $383,000 ÷ $460,000 = 0.8326, or 83.3%.
The typical-metro gap (34.8%) is the middle value of the 45 metro gaps. Each metro gets one vote, whatever its size.
How we checked it
On Sept. 29, 2026, we downloaded the metro, national, and state ZIPs from FHFA. Every comparison input for all 100 metro rows matched the source, including suppressed cells. We also checked every year of the national series and the California state row, then recomputed all gaps, shares, rankings, and group-size tests. We tested our national rows against numbers FHFA published itself. FHFA's California blog says 0.9% of U.S. purchase appraisals had an ADU in 2013 and 1.2% in 2023, a 36% rise; our rows give 0.91%, 1.25%, and 36.4%. FHFA reports "annualized growth" of 7.20% and 6.25% for U.S. homes with and without an ADU; our medians give exactly 72.0% ÷ 10 and 62.5% ÷ 10.
For California, the 12 areas in our table hold 3,849 ADU purchase appraisals, compared with 4,909 in the state file. The blog reports 4,910; we show the source difference rather than treating the figures as interchangeable.
Group sizes and withheld numbers
FHFA uses small-group suppression and related-cell suppression to protect privacy. It can withhold a related cell so a hidden value cannot be worked out by subtraction. A withheld cell does not prove that its own group was small. Source Seven of the 100 areas have withheld comparisons: Dayton, Elgin, Gary, Lake County–Kenosha County, Milwaukee, Syracuse, and Wichita.
We set a second rule of our own: headline numbers use only metros with at least 100 appraisals in each group. That's an editorial choice to reduce reliance on small groups, not proof that the groups contain comparable homes. It's not a statistical test or an FHFA standard. Here's how the picture changes with other cutoffs.
| Rule: at least this many appraisals in each group | Metros included | Gap higher with ADU | Lowest gap | Highest gap | Typical (median) gap |
|---|---|---|---|---|---|
| Any (all published) | 93 | 88 | −10.8% | +105.9% | +36.9% |
| 25 | 88 | 84 | −10.8% | +90.0% | +36.3% |
| 50 | 76 | 72 | −10.8% | +89.1% | +33.5% |
| 100 | 45 | 43 | −3.8% | +83.3% | +34.8% |
| 200 | 24 | 23 | −3.8% | +83.3% | +38.0% |
| 300 | 15 | 14 | −3.8% | +67.4% | +39.2% |
| Source: The Dwelling Index analysis of FHFA UAD Aggregate Statistics, 2023 Enterprise single-family purchase appraisals. | |||||
At every cutoff shown, homes with an ADU had a higher median appraisal in the large majority of metros.
Our general research rules are on our methodology page.
What does this data show, and what doesn't it?
It shows the gap between the middle appraisal of homes with an ADU and homes without one, metro by metro, for 2023 home-purchase loans. It doesn't show what building an ADU adds, what a home will sell for, or whether an ADU pays for itself.
The appraisals were submitted to Fannie Mae and Freddie Mac for home-purchase loans. It does not represent purchases with no appraisal submitted through that channel, such as many cash purchases. FHFA's files also include some appraisals for loans the two companies didn't end up buying, or for deals that didn't close.
The ADU flag comes from the appraiser. FHFA warns it can have data-entry errors both ways: some homes marked as having an ADU may not, and some with one may not be marked.
This ADU-status extract doesn't say whether an ADU was detached, attached, or a garage conversion, whether it was permitted, how big it was, or whether it was rented. It doesn't cover every city — only the 100 metro areas and divisions in FHFA's file, using that file's names and boundaries.
How do I cite this page?
Cite the year of the appraisals and the date of our analysis. For one metro, keep both medians, both counts, and the note that the gap compares different homes.
Page citation:
The Dwelling Index. (2026, September). ADU Property Values by Metro: Homes With an ADU Had Higher Median Appraisals in 43 of 45 Metros in 2023. Dwelling Index Research. https://dwellingindex.com/research/adu-property-values-by-metro/
One-metro citation (example):
The Dwelling Index's analysis of FHFA's 2023 Enterprise single-family purchase-appraisal data found a median appraisal of $843,000 for homes with an ADU and $460,000 for homes without one in Nashville-Davidson-Murfreesboro-Franklin, TN — a $383,000, or 83.3%, gap based on 213 and 20,247 appraisals. The gap compares different homes; it is not the value an ADU adds. https://dwellingindex.com/research/adu-property-values-by-metro/#metro-34980
Reuse: You may reuse The Dwelling Index's original calculations, table design, and charts; please credit The Dwelling Index by name. Keep the FHFA, Porch, and study attributions, dates, and limits wherever they apply. This permission covers only our contribution, not third-party text or artwork; underlying source terms still apply. No link is required.
Where can I download the data?
The files are free, with no form: the metro file has all 100 areas, including the seven withheld ones, and the national file has every year from 2013 to 2023. The California supplement preserves both conflicting source figures. Every row carries its source link and the date we checked it.
- adu-property-values-by-metro-2023.csv — 100 rows, one per metro area or division.
- adu-property-values-national-2013-2023.csv — 11 rows, one per year.
- adu-property-values-california-source-comparison-2023.csv — two rows: the FHFA state file and its blog.
Chart downloads: Metro gaps · National history · What the numbers measure
Frequently asked questions
Does an ADU increase property value?
In 2023, homes with an ADU had higher median appraisals in 43 of the 45 metros with at least 100 appraisals per group. But those are different homes. A peer-reviewed study's preferred estimates were 7% to 9% for ADU-related assessed-value and sale-price differences in city of Los Angeles data from 2013 to 2019 — not a guaranteed gain for one home. Sources: Los Angeles study
How do you calculate the value of an ADU property?
This page calculates a gap, not a home's value. Subtract the no-ADU median from the ADU median, divide by the no-ADU median, and multiply by 100: in Nashville, ($843,000 − $460,000) ÷ $460,000 × 100 = 83.3%. A single home needs its own appraisal; see how appraisers value an ADU.
Are ADUs a good investment?
This data can't tell you. It has no building costs, rents, or loan costs, and it compares different homes. Use your metro's row as context, then run your own costs and rent.
Does an ADU add 35% to a home's value?
The cited Porch study does not show that. It reported 35% from August 2021 asking prices; its full aggregation cannot be reproduced from the archive. The typical 2023 metro appraisal gap was 34.8% — close in size, but it compares different homes, not the same home before and after an ADU.
Why is my city missing?
FHFA's file covers 100 metro areas and divisions, and it withheld comparisons for seven of them. Your city may sit inside a larger metro in the table — Franklin, Tenn., for example, is part of the Nashville metro. Search for the area's name or a city named in its label.
Does a negative gap mean an ADU hurts value?
No. In Nassau and Suffolk counties, N.Y., the median for homes with an ADU was $25,000 lower (−3.8%), but that compares different homes. It doesn't show what happened when an ADU was added to any one house.
Are these 2026 home values?
No. They're 2023 appraisals, the newest full year in the FHFA UAD Aggregate Statistics release checked on Sept. 29, 2026. September 2026 is when we did the analysis.
What sources did we use?
- Federal Housing Finance Agency, "Uniform Appraisal Dataset (UAD) Aggregate Statistics" (data release list, version 3.3, Dec. 18, 2024). <https://www.fhfa.gov/data/uad> — checked Sept. 29, 2026
- FHFA, UAD Aggregate Statistics, Enterprise single-family, 100 largest metro areas (UADAggs_ent_sf_cbsa_v3_3). <https://www.fhfa.gov/sites/default/files/2024-12/UADAggs_ent_sf_cbsa_v3_3.zip> — checked Sept. 29, 2026
- FHFA, UAD Aggregate Statistics, Enterprise single-family, national (UADAggs_ent_sf_nat_v3_3). <https://www.fhfa.gov/sites/default/files/2024-12/UADAggs_ent_sf_nat_v3_3.zip> — checked Sept. 29, 2026
- FHFA, "UAD Aggregate Statistics Data File Dictionary." <https://www.fhfa.gov/document/d/uad-as/uad-aggregate-statistics-data-file-dictionary.pdf> — checked Sept. 29, 2026
- FHFA, "UAD Aggregate Statistics Data File Overview." <https://www.fhfa.gov/document/d/uad-as/uad-aggregate-statistics-data-file-overview.pdf> — checked Sept. 29, 2026
- FHFA Stats Blog, "Trends in Median Appraised Value for Properties With Accessory Dwelling Units in California" (Jan. 2, 2025). <https://www.fhfa.gov/blog/statistics/trends-in-median-appraised-value-for-properties-with-accessory-dwelling-units-in-california> — checked Sept. 29, 2026
- Jan K. Brueckner and Sarah Thomaz, "ADUs in Los Angeles: Where are they located and by how much do they raise property value?" Real Estate Economics 52(3), 885–907 (2024). <https://doi.org/10.1111/1540-6229.12471> (full text) — checked Sept. 29, 2026
- Sarah Thomaz, UC Irvine working paper on ADUs in Los Angeles. <https://www.economics.uci.edu/files/docs/workingpapers/JobMarketPaper_Thomaz.pdf> — checked Sept. 29, 2026
- Porch Research, "2021 Study: How Much Value Do Granny Flats and other Accessory Dwelling Units Add to a Home?" (Sept. 7, 2021), archived Feb. 1, 2022. <https://web.archive.org/web/20220201143627/https://porch.com/advice/state-of-adu-market-2021> — archive checked Sept. 29, 2026; original URL returned "not found" that day
- Freddie Mac, "Granny Flats, Garage Apartments, In-Law Suites: Identifying Accessory Dwelling Units from Real Estate Listing Descriptions Using Text Mining" (July 16, 2020). <https://www.freddiemac.com/research/insight/20200716-identifying-accessory-dwelling-units-from-real-estate> — checked Sept. 29, 2026
- RenoFi, "Is an ADU a good investment?" <https://www.renofi.com/adus/how-an-adu-increases-property-value/> — checked Sept. 29, 2026
- HomeLight, "How Much Value Does an Accessory Dwelling Unit Add?" <https://www.homelight.com/blog/accessory-dwelling-unit/> — checked Sept. 29, 2026
- FHFA, UAD Aggregate Statistics, Enterprise single-family, states (UADAggs_ent_sf_state_v3_3), California rows. <https://www.fhfa.gov/sites/default/files/2024-12/UADAggs_ent_sf_state_v3_3.zip> — checked Sept. 29, 2026
- Consumer Financial Protection Bureau, "What are appraisals and why do I need to look at them?" <https://www.consumerfinance.gov/ask-cfpb/what-are-appraisals-and-why-do-i-need-to-look-at-them-en-167/> — checked Sept. 29, 2026
- HomeLight, "What Is an ADU? Should You Build an Accessory Dwelling Unit?" (March 12, 2026), inspected only to trace its attribution of the 35% claim. <https://www.homelight.com/blog/what-is-adu/> — checked Sept. 29, 2026
- National Association of Realtors, "Study: ADUs Can Add 35% to Home's Value," inspected as coverage crediting Porch, not as an original dataset. <https://www.nar.realtor/magazine/real-estate-news/study-adus-can-add-35-to-home-s-value> — checked Sept. 29, 2026
Dwelling Index Research is the research and reference section of dwellingindex.com.